Monitor.
Follow every run in the Odara ETL Monitor: filtering, run details, real-time progress and logs.
8. Monitor
8.1 Overview
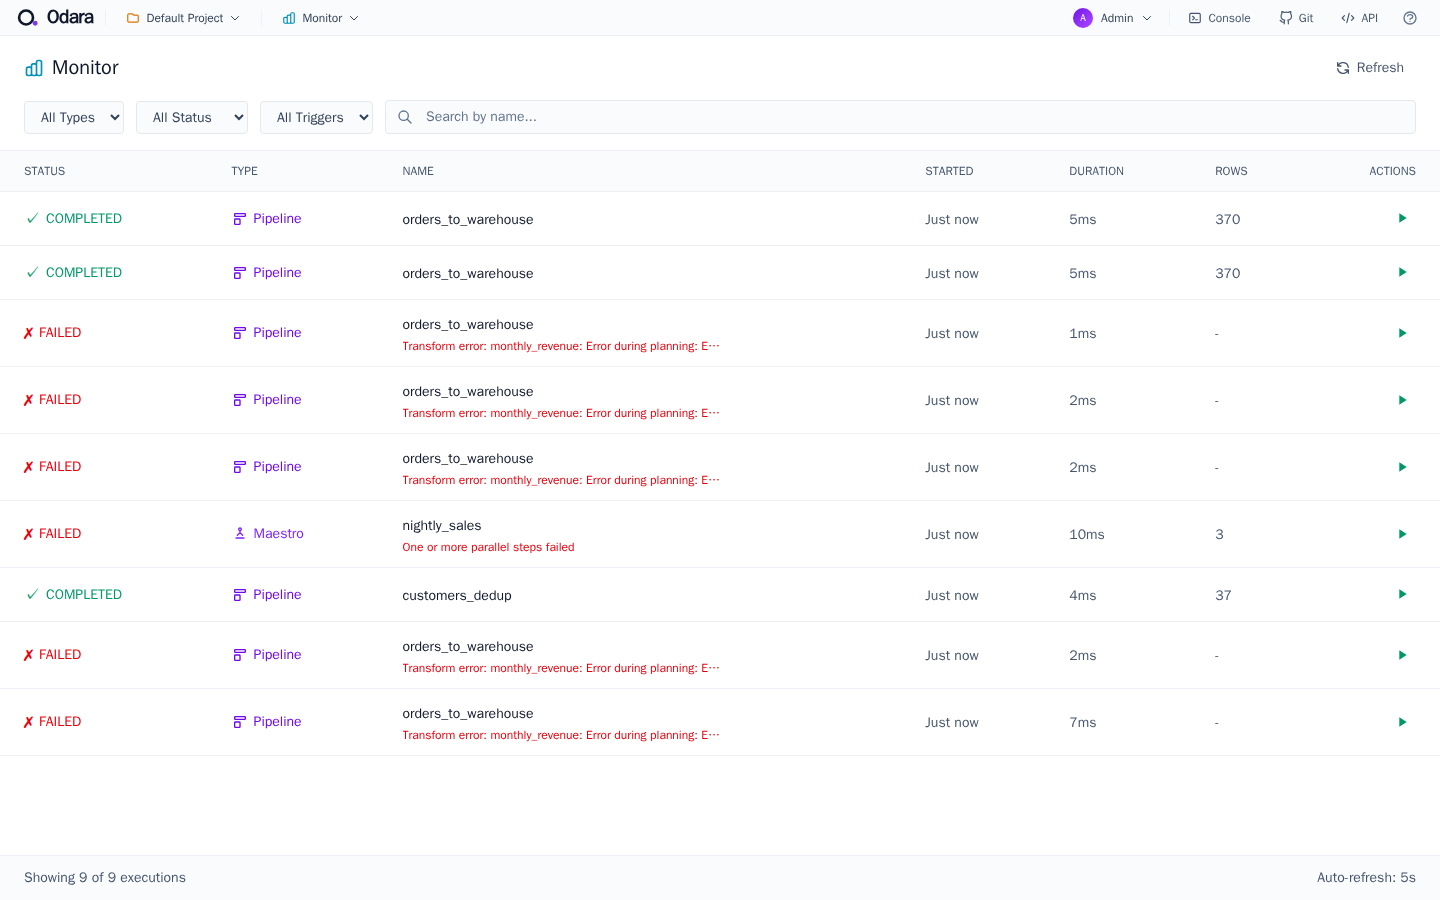
The Monitor page shows every pipeline and maestro execution, whether manual, scheduled, or API-triggered. Auto-refreshes every 5 seconds.
8.2 Filtering
Filter by type (Pipeline / Maestro), status (Running / Succeeded / Failed / Canceled), and free-text search over names. Results are paginated.
8.3 Execution details
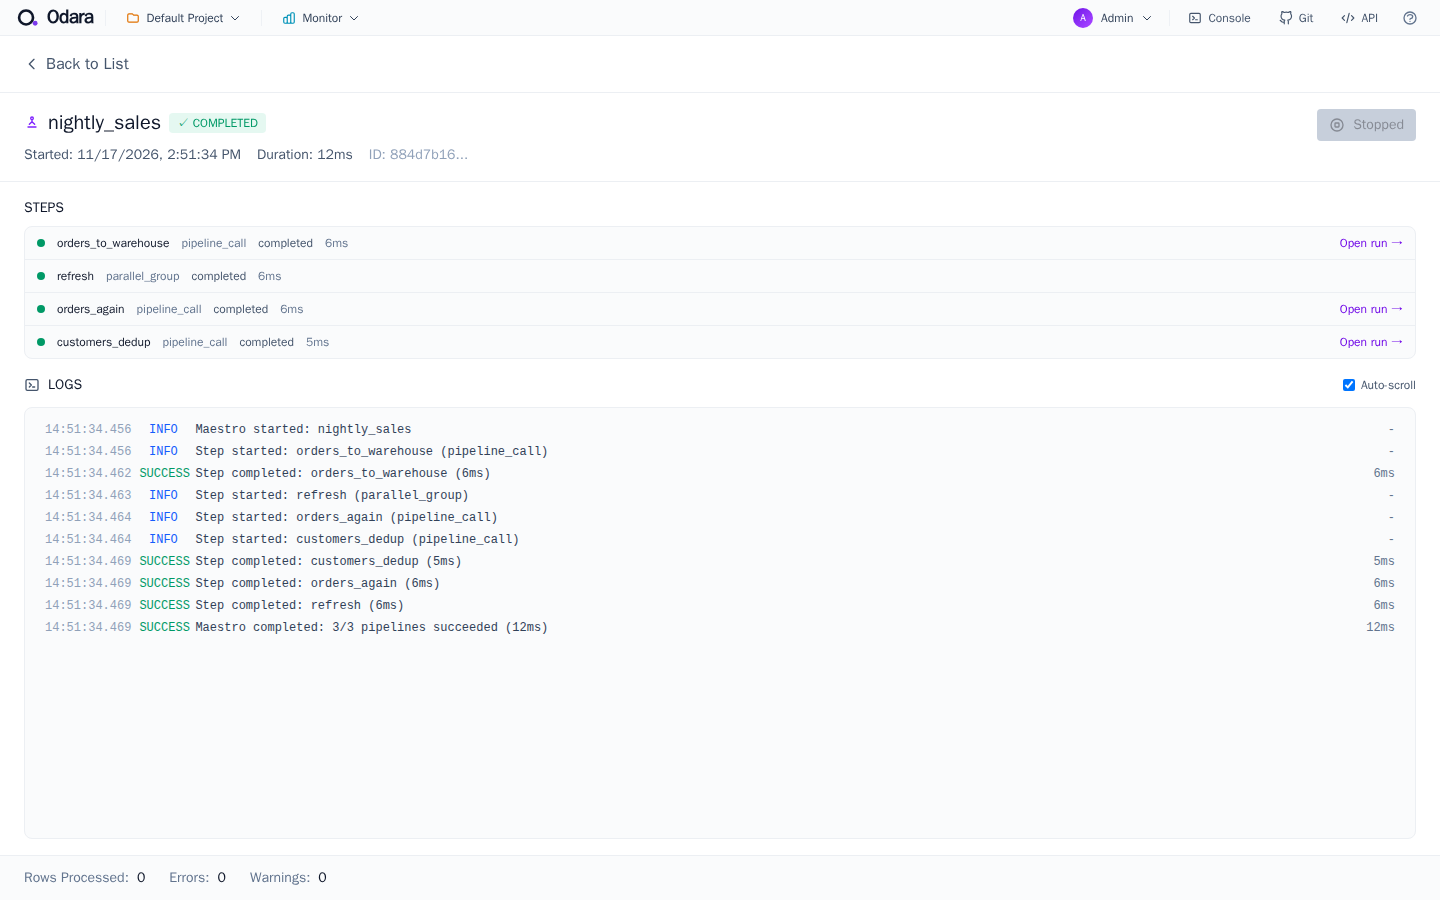
Click any execution row to see per-node breakdown: started/finished, duration, row count in/out, any errors. Failed executions show the full stack trace for debugging. Each run also shows the environment it ran in (Environment: <name>) and, for an isolated run, the runner with its limits. An isolated run is recorded exactly like a local one, per-node rows and target history included.
A Maestro run lists its steps; Open run → on a step opens the child pipeline run with its per-node rows, and the back button returns to the Maestro.

8.4 Real-time updates
Running executions stream progress via Server-Sent Events — no polling, no refresh needed. The Monitor page subscribes automatically when a row is in the "Running" state.
8.5 Logs
From the execution details, click Logs to see the full console log captured during the run. Logs persist in SQLite and can be exported as .txt.