The editor.
The Odara ETL pipeline editor: interface, explorer, nodes palette, configuring nodes, tabs, shortcuts, preview, execution, the console log and data quality tests.
3. Editor
3.1 Interface overview
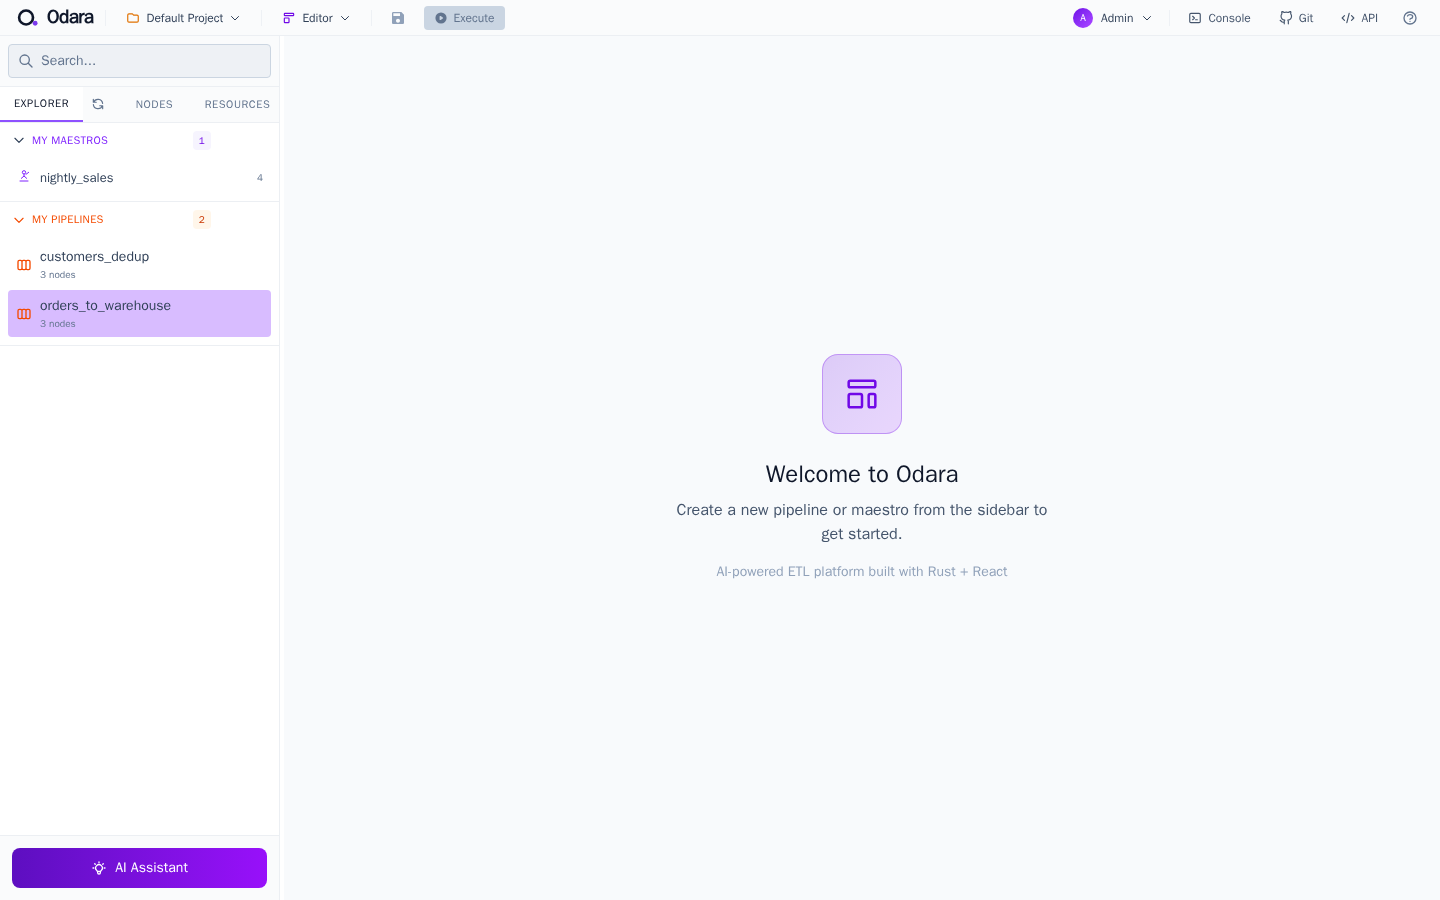
The Odara editor is the central workspace. It has four main areas:
- Top bar: project selector, page menu (Editor / Schedule / Monitor / Documentation / Admin / API Keys / Import Utility), the environment picker (DEV / STG / PROD… with a badge saying where that environment runs: Local, Docker, AWS or Google), Save, Execute, Abort, Git toggle, AI Chat toggle, API reference, user menu.
- Left sidebar: Explorer tab (Pipelines / Maestros / Metadata / Folders), Nodes palette tab, Resources tab.
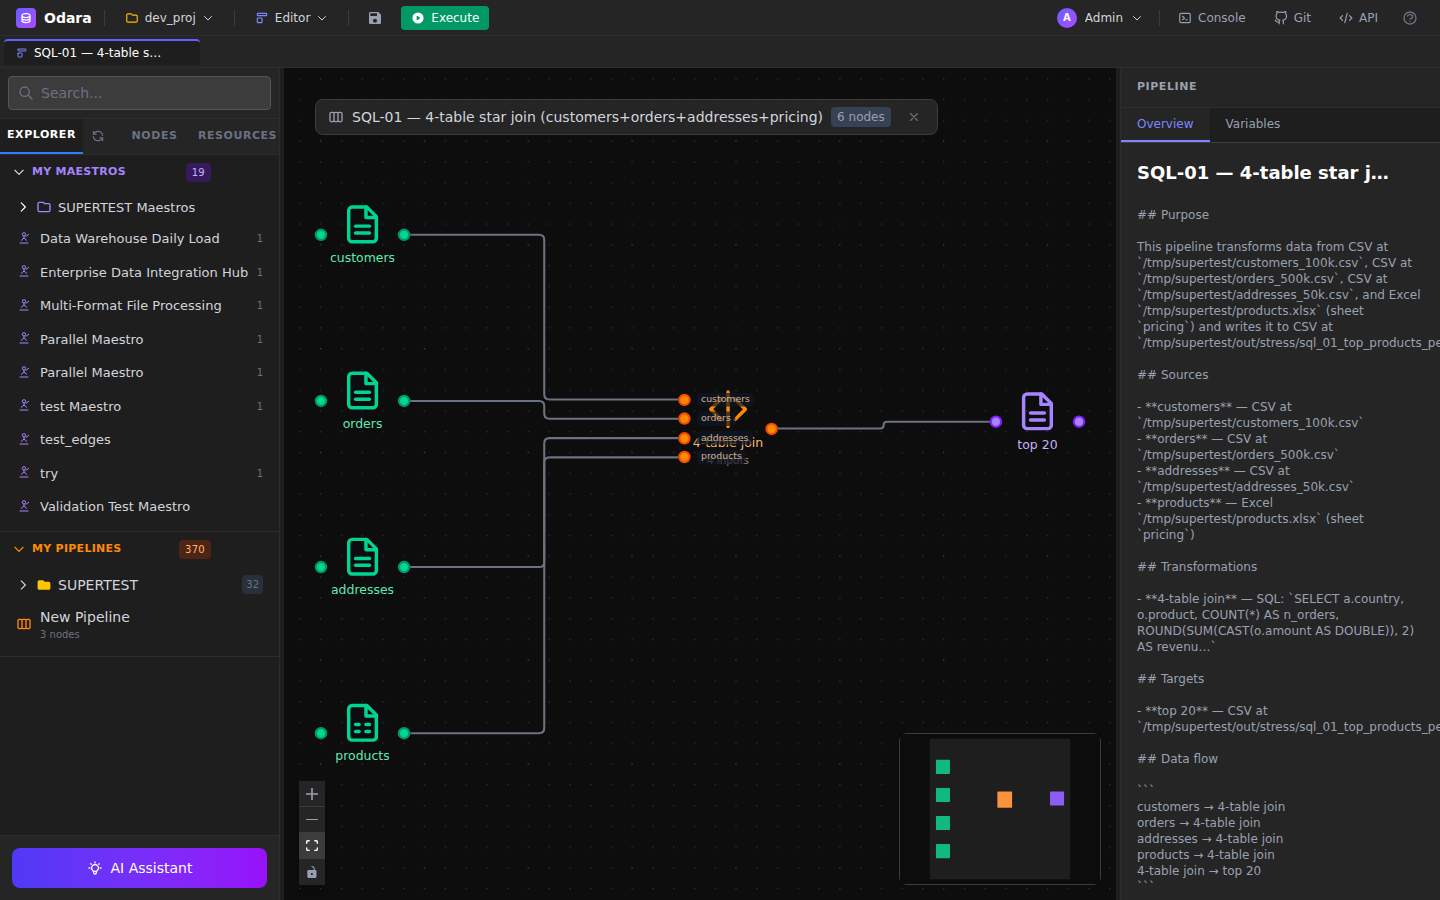
- Canvas: where you build pipelines or maestros. Supports zoom, pan, minimap, and multi-tab.
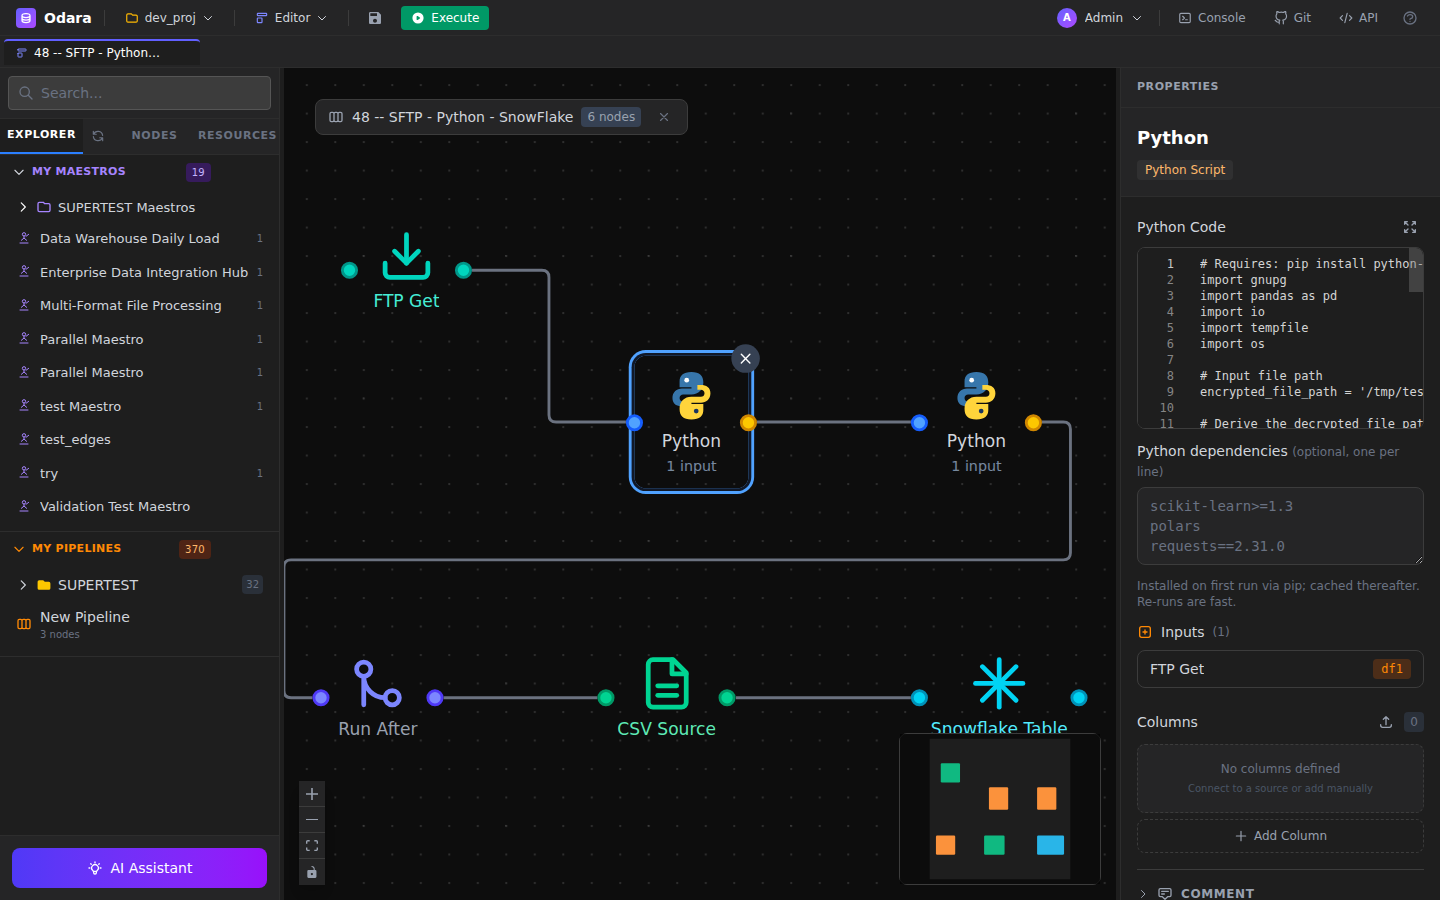
- Properties panel (right): appears when you select a node — shows its configuration.
3.2 Explorer
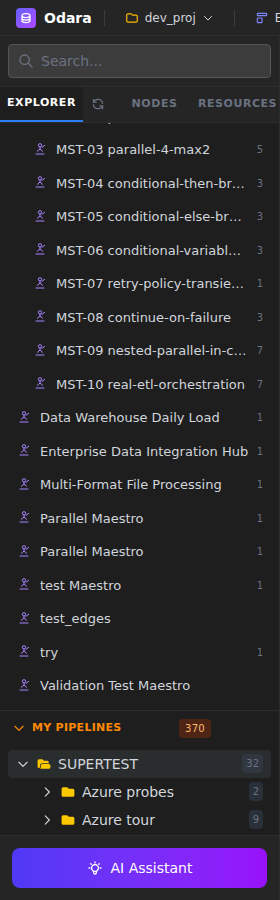
The Explorer lists all pipelines, maestros, and metadata (resources) in the current project. Click any item to select it; double-click to open it on the canvas.
Use the search bar at the top to filter by name. Items can be grouped into folders using the + New Folder button.
3.3 Nodes palette
The Nodes palette is the catalog of every available node type. Open it from the sidebar tab, or press Ctrl+P for a quick search:
- Ingest: sources that read data (Files, Databases, Data Warehouses, Object Storage, Productivity, Network APIs).
- Transform: SQL and Python transforms.
- Deliver: targets that write data (same categories as Ingest, plus Notifications and Debug).
- Orchestrate: control-flow nodes (Sleep, Run After, Iterate).
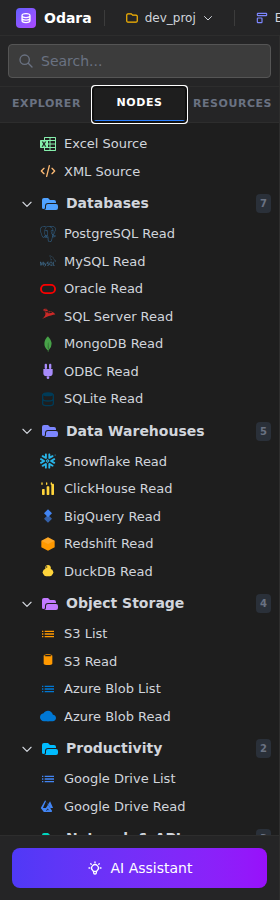

Drag a node from the palette onto the canvas to add it. See Section 4. Nodes Reference for every node's configuration.
3.3.1 A pipeline on the canvas
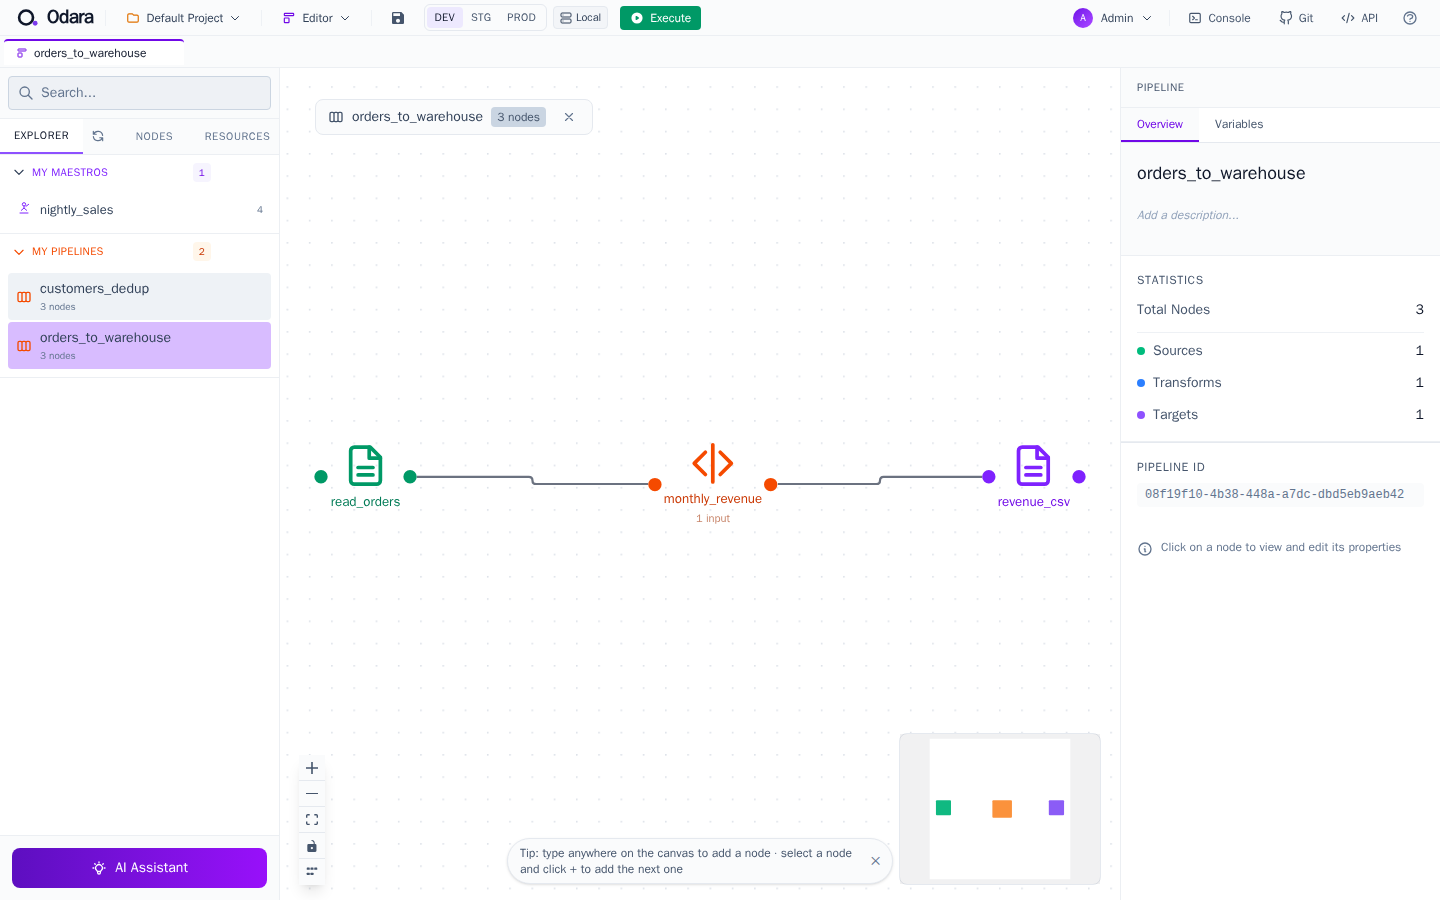
Once you open a saved pipeline (or drag nodes to build one), the editor shows the full graph with connections, a minimap for navigation, zoom controls, and a properties pane that opens when you click any node.
3.4 Configuring nodes
Click any node on the canvas to open its Properties panel. Each node has its own schema; common patterns include:
- Path fields accept absolute or relative paths, and support variable interpolation:
C:\data\[email protected] - Connection fields can be filled manually or pulled from a saved Resource (see Section 5).
- SQL / Python fields open in a Monaco code editor with syntax highlighting.
- Credential fields (passwords, access keys) are encrypted at rest with AES-GCM.
3.5 Multi-tab
Open multiple pipelines at once — each gets its own tab above the canvas. Edits are preserved per-tab. Close a tab with the × icon; if there are unsaved changes, you'll be asked to confirm.
3.6 Keyboard shortcuts
| Shortcut | Action |
|---|---|
Ctrl+S | Save current pipeline / maestro |
Ctrl+P | Quick search for nodes (palette) |
Ctrl+Enter | Execute pipeline |
Delete | Remove selected node or edge |
Ctrl+Z / Ctrl+Y | Undo / redo |
F | Fit canvas to content |
3.7 Preview output
Right-click any node and choose Preview to run only up to that node and view the first N rows in a data grid. This is the fastest way to debug a transform without executing the full pipeline.
3.8 Execution
Click Execute in the top bar. Progress streams live over Server-Sent Events: you'll see each node turn yellow (running), then green (completed) with row count and duration. If a node fails, it turns red and downstream nodes are skipped.
Click Abort to cancel a running execution — all in-flight work is stopped gracefully via cancellation tokens. In an isolated run, Abort also stops the runner (container, Fargate task or Cloud Run execution).
The run uses the environment picked in the top bar for this tab: its variable values and its Execution setting (Local, Docker, AWS ECS Fargate or Google Cloud Run). The choice belongs to the pipeline's tab and does not change the server's active environment — see 15.3.
3.9 Console log
The Console panel at the bottom shows structured logs during execution: pipeline started, node started/completed/failed, row counts, durations, and final status. Click the Console button in the top bar to toggle it.
3.10 Data Quality Tests
Every node has a Tests tab in its Properties panel. Add assertions that run automatically after the node completes:
- Row count: expect rows ≥ N / ≤ N / exactly N
- Non-null: column has no null values
- Unique: column has unique values
- Range: numeric column in [min, max]
- Custom SQL: arbitrary expression must return TRUE
Failed tests appear as warnings in the console; you can configure a pipeline to abort on test failure or continue with warnings.