Monitor
One line: Monitor is the single page where every run of every pipeline and maestro shows up — succeeded, failed, or in flight — with one click to re-run and one click to see what happened.
This tutorial walks through Monitor end to end on a fresh install,
using the bundled [email protected] account. You'll learn how to:
- Open Monitor
- Read the list
- Filter and search
- Re-run an execution
- Open the execution detail — live, with streaming logs
- Re-open after completion to see the final state and full log trace
It takes about 7 minutes.
1. Sign in
Start the app (./start-dev.sh from the repo root, or the production
binary), then open http://localhost:5175. You'll land on the sign-in
screen.
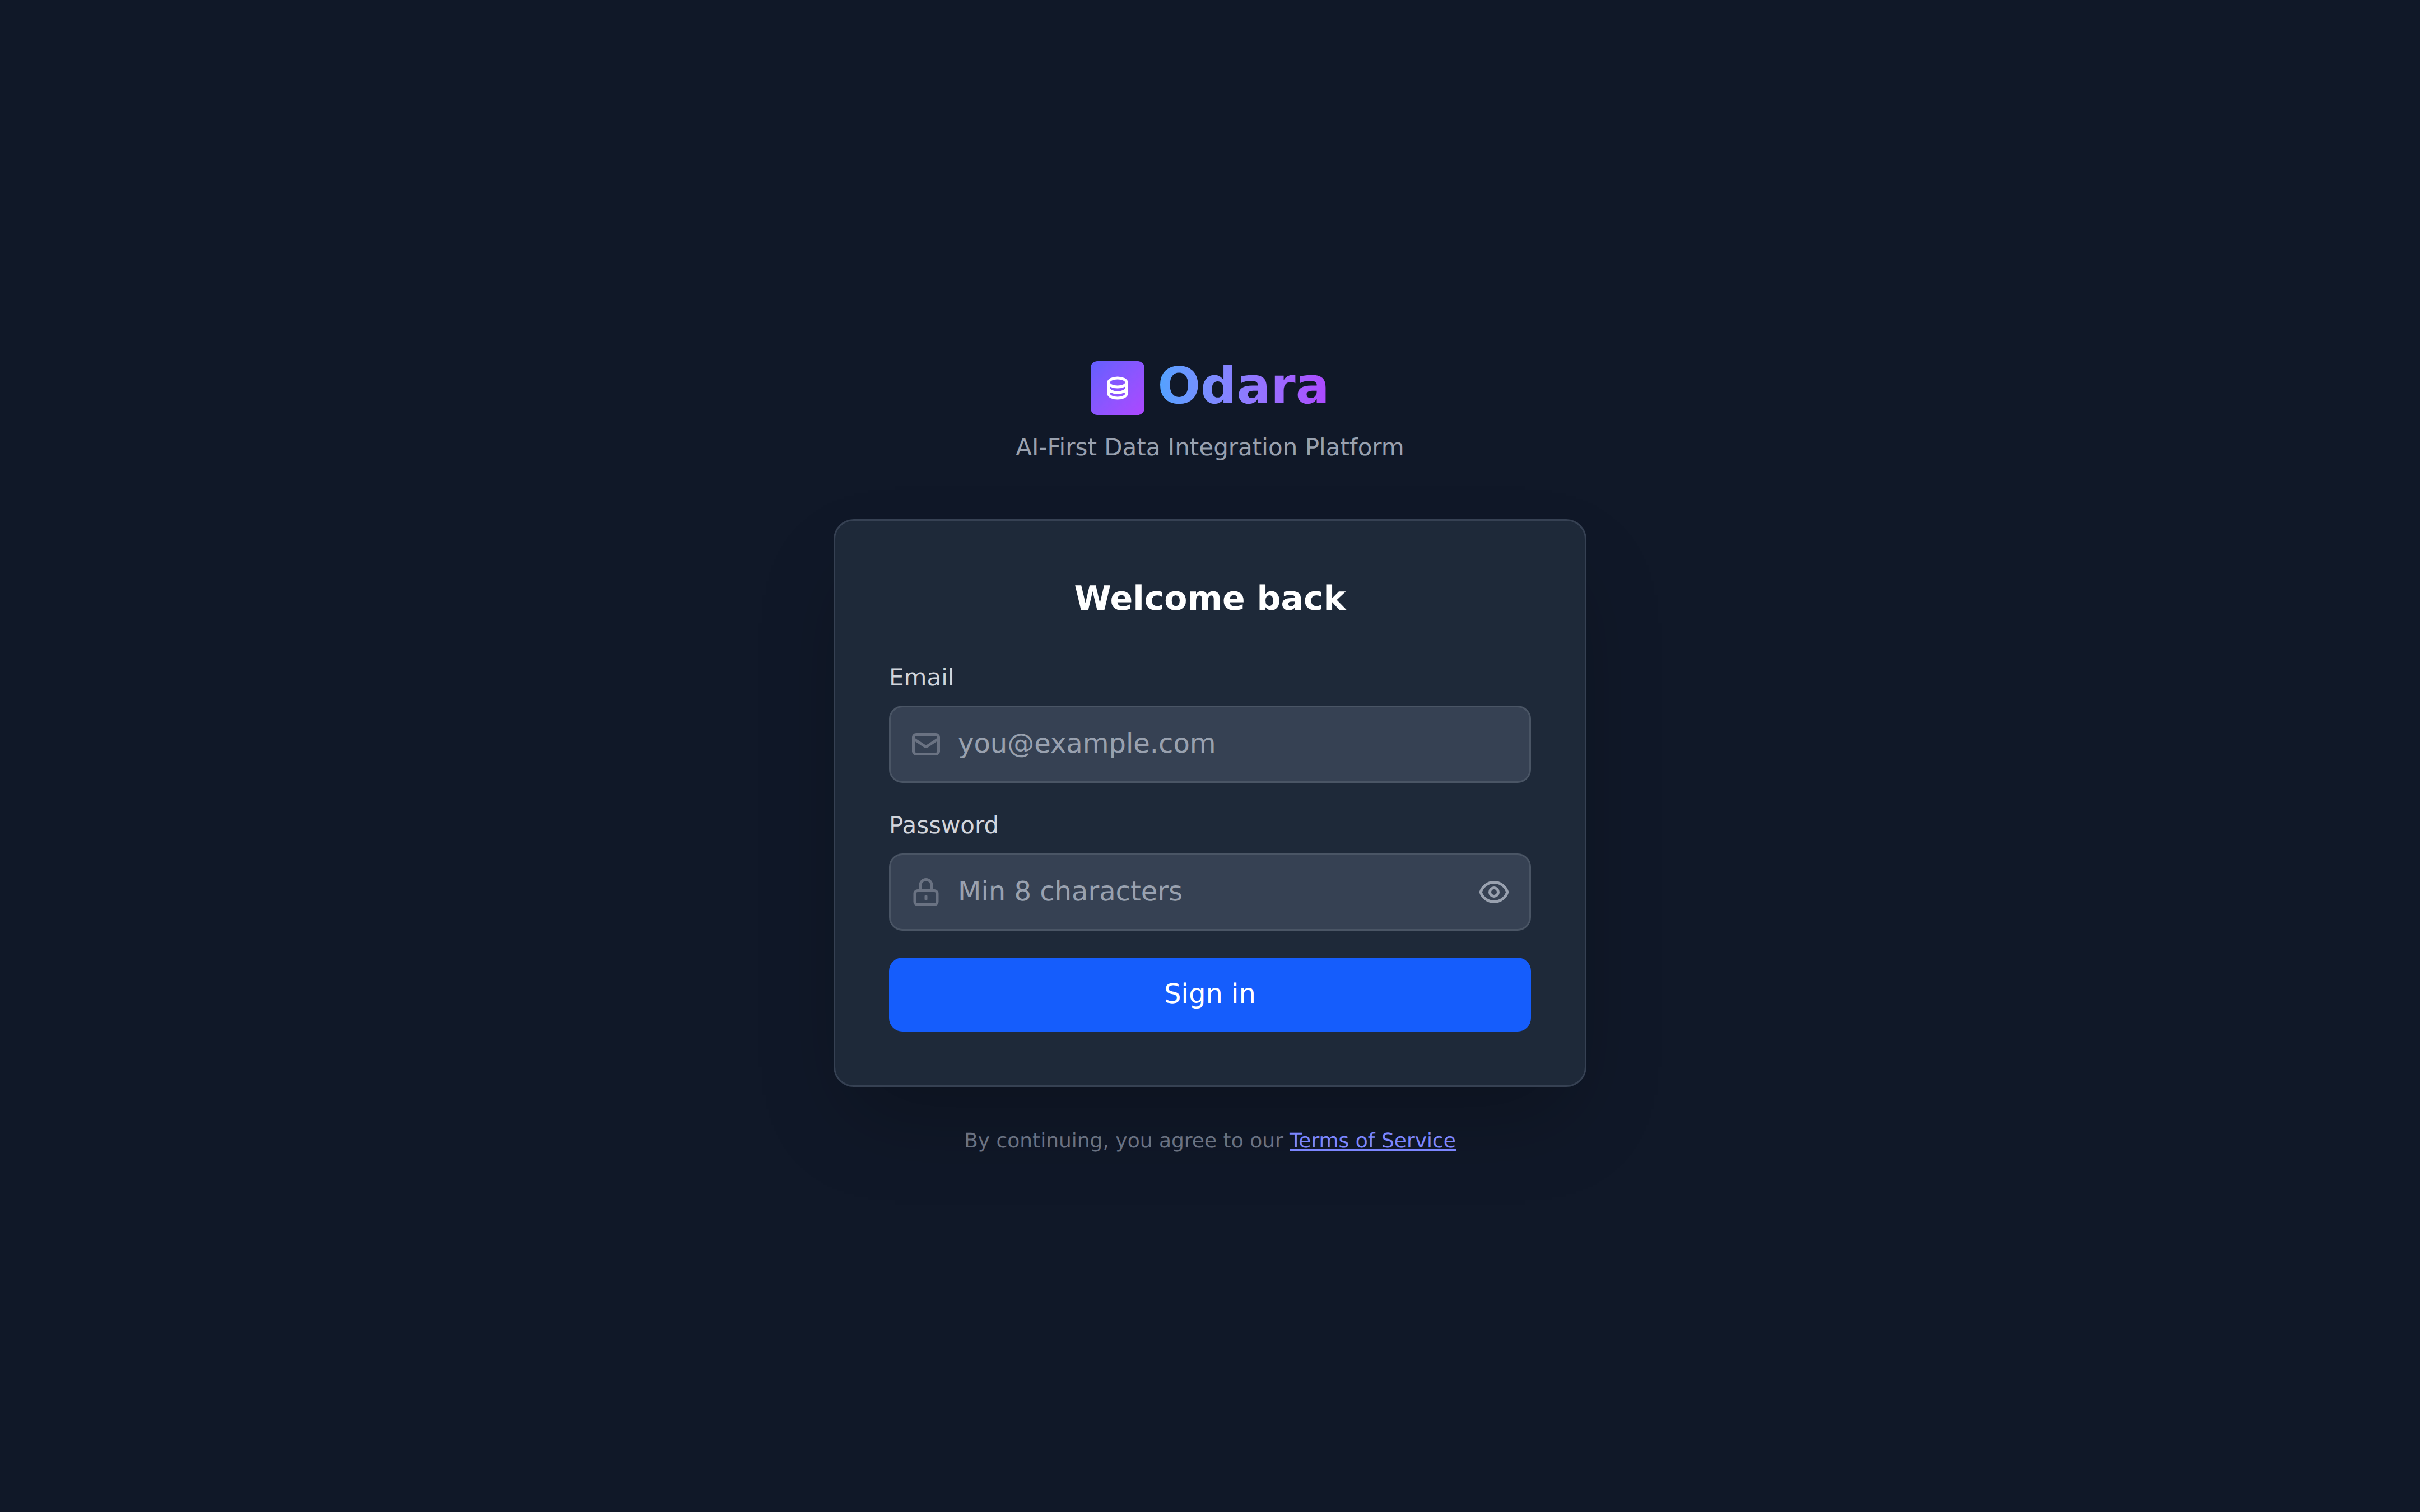
Enter your credentials and click Sign in. If you're following
along with the demo seed, that's [email protected].
2. Open Monitor
There is no top-level Monitor link in the sidebar. Monitor lives inside the workspace switcher in the header — click Editor ▼ in the top bar and pick Monitor.
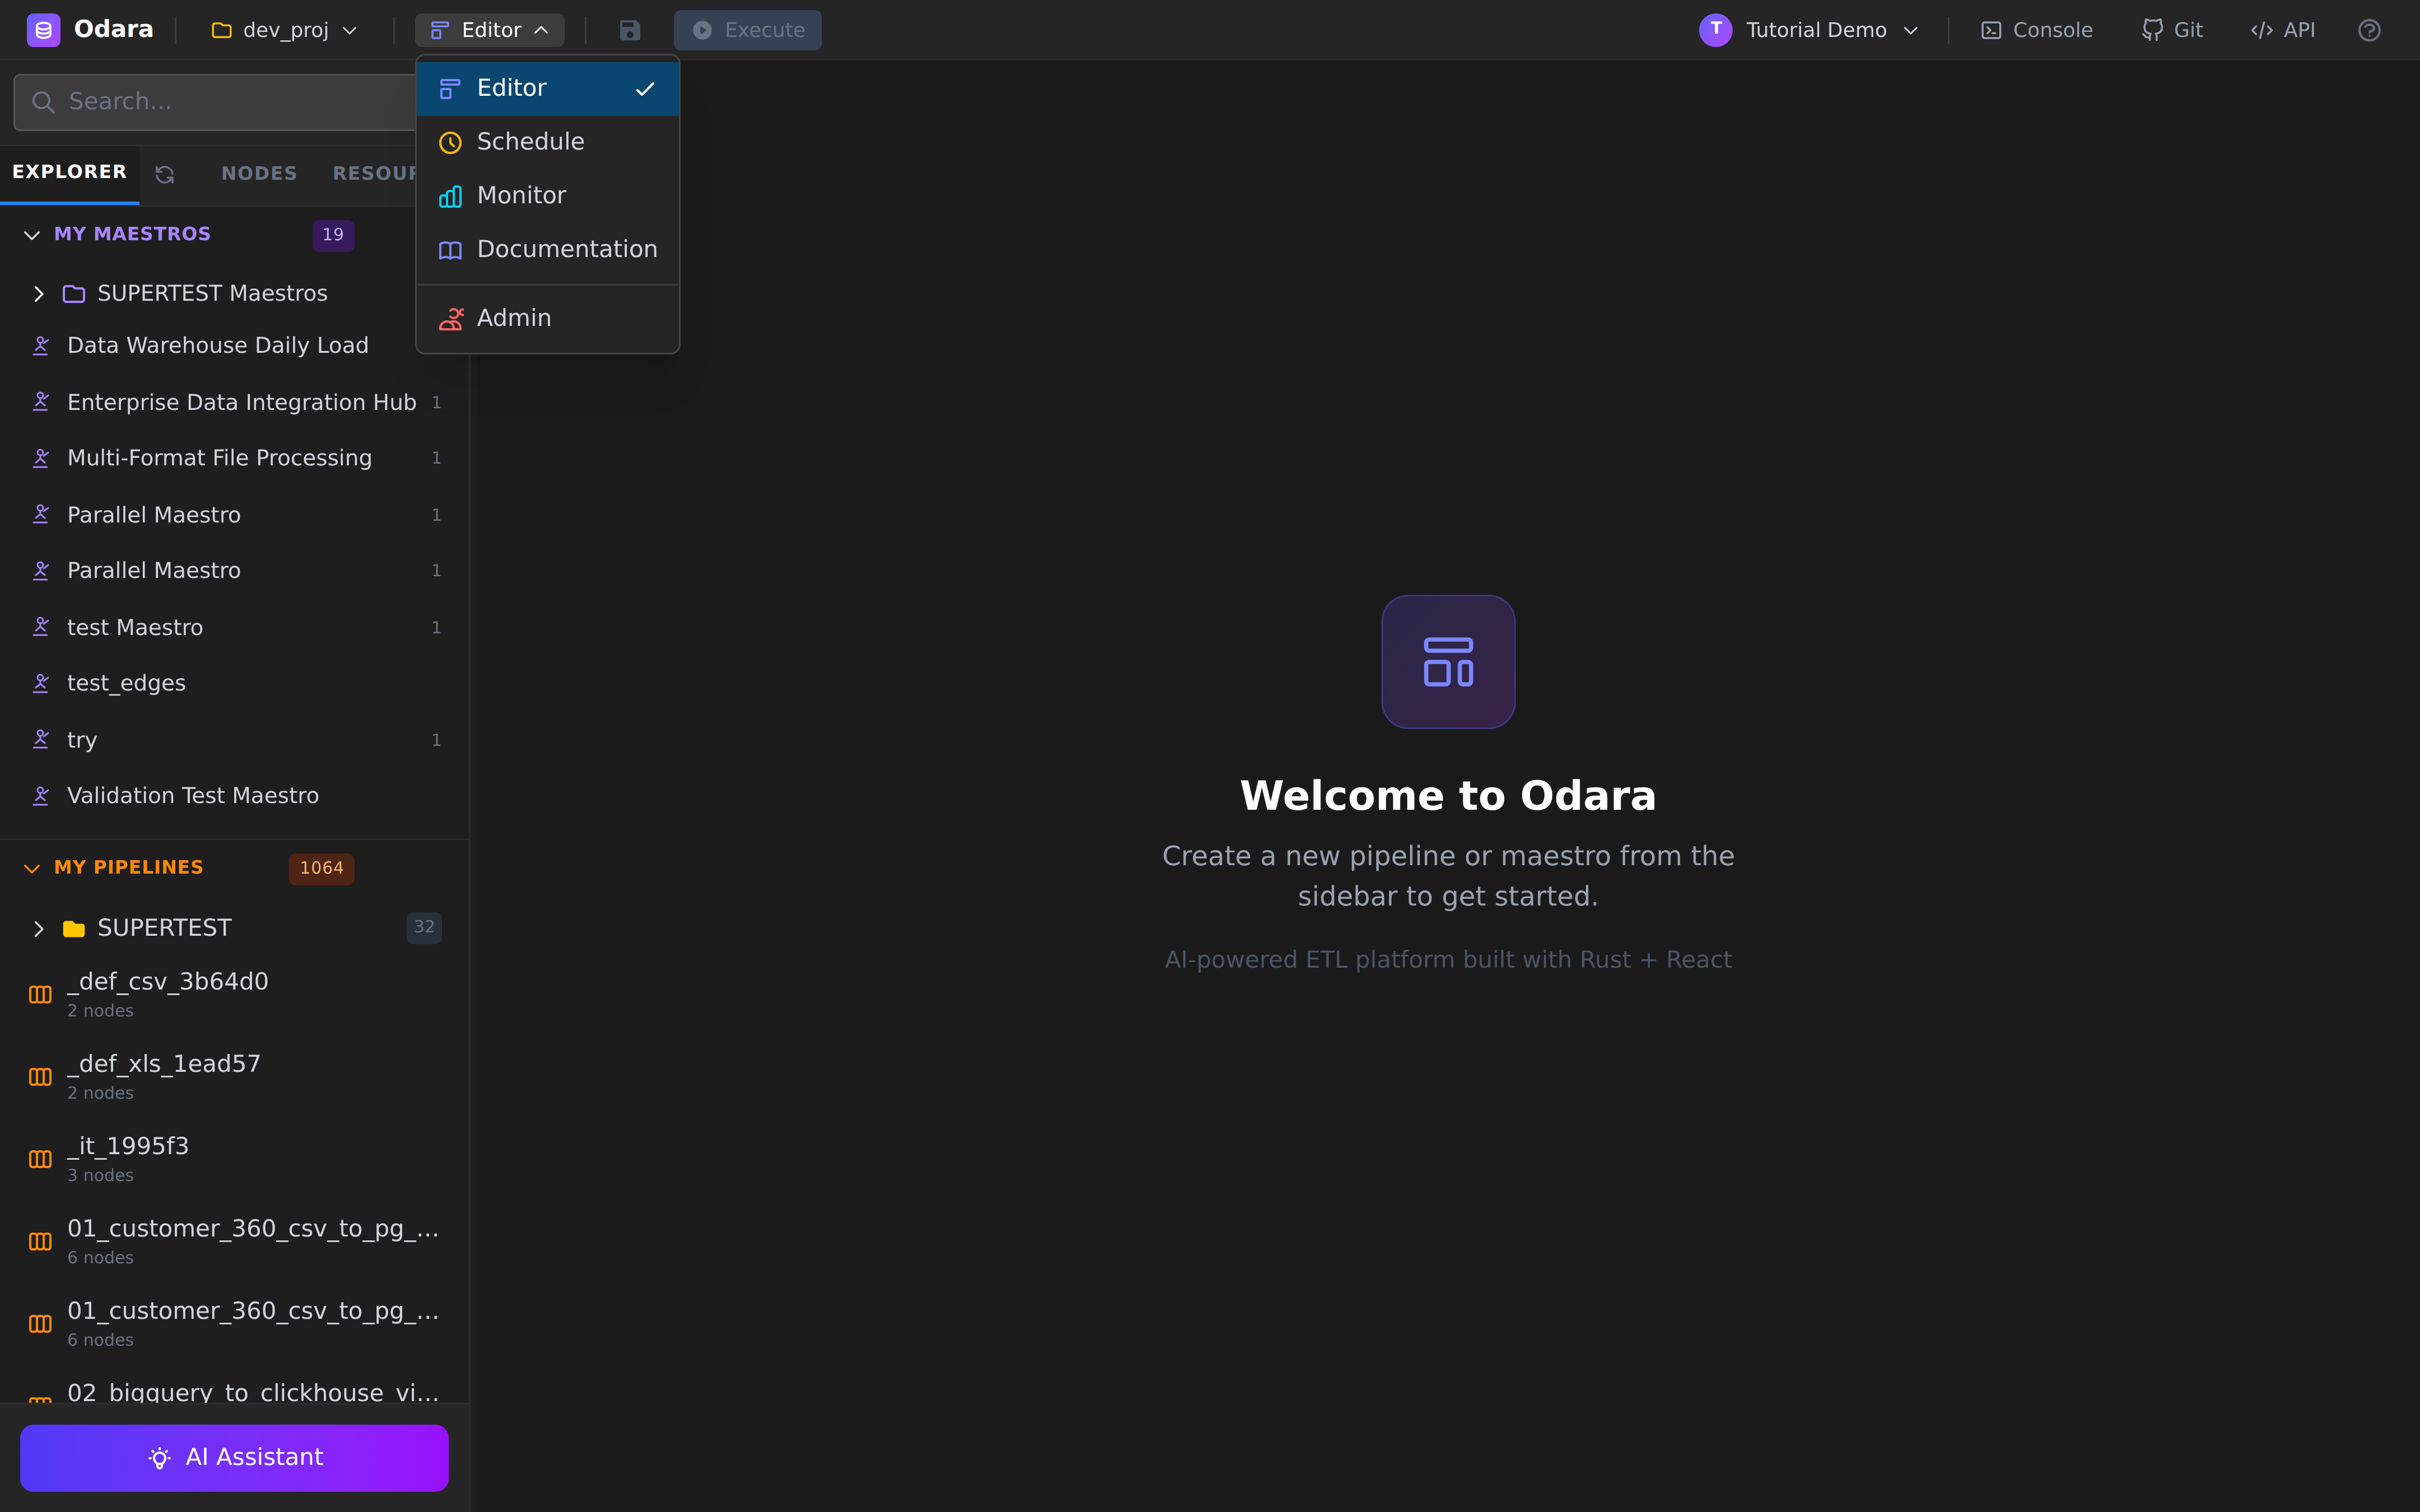
The workspace title in the header will switch from Editor to Monitor, and the page changes to a single table that lists every execution from every pipeline and every maestro in the current project.
3. Read the list
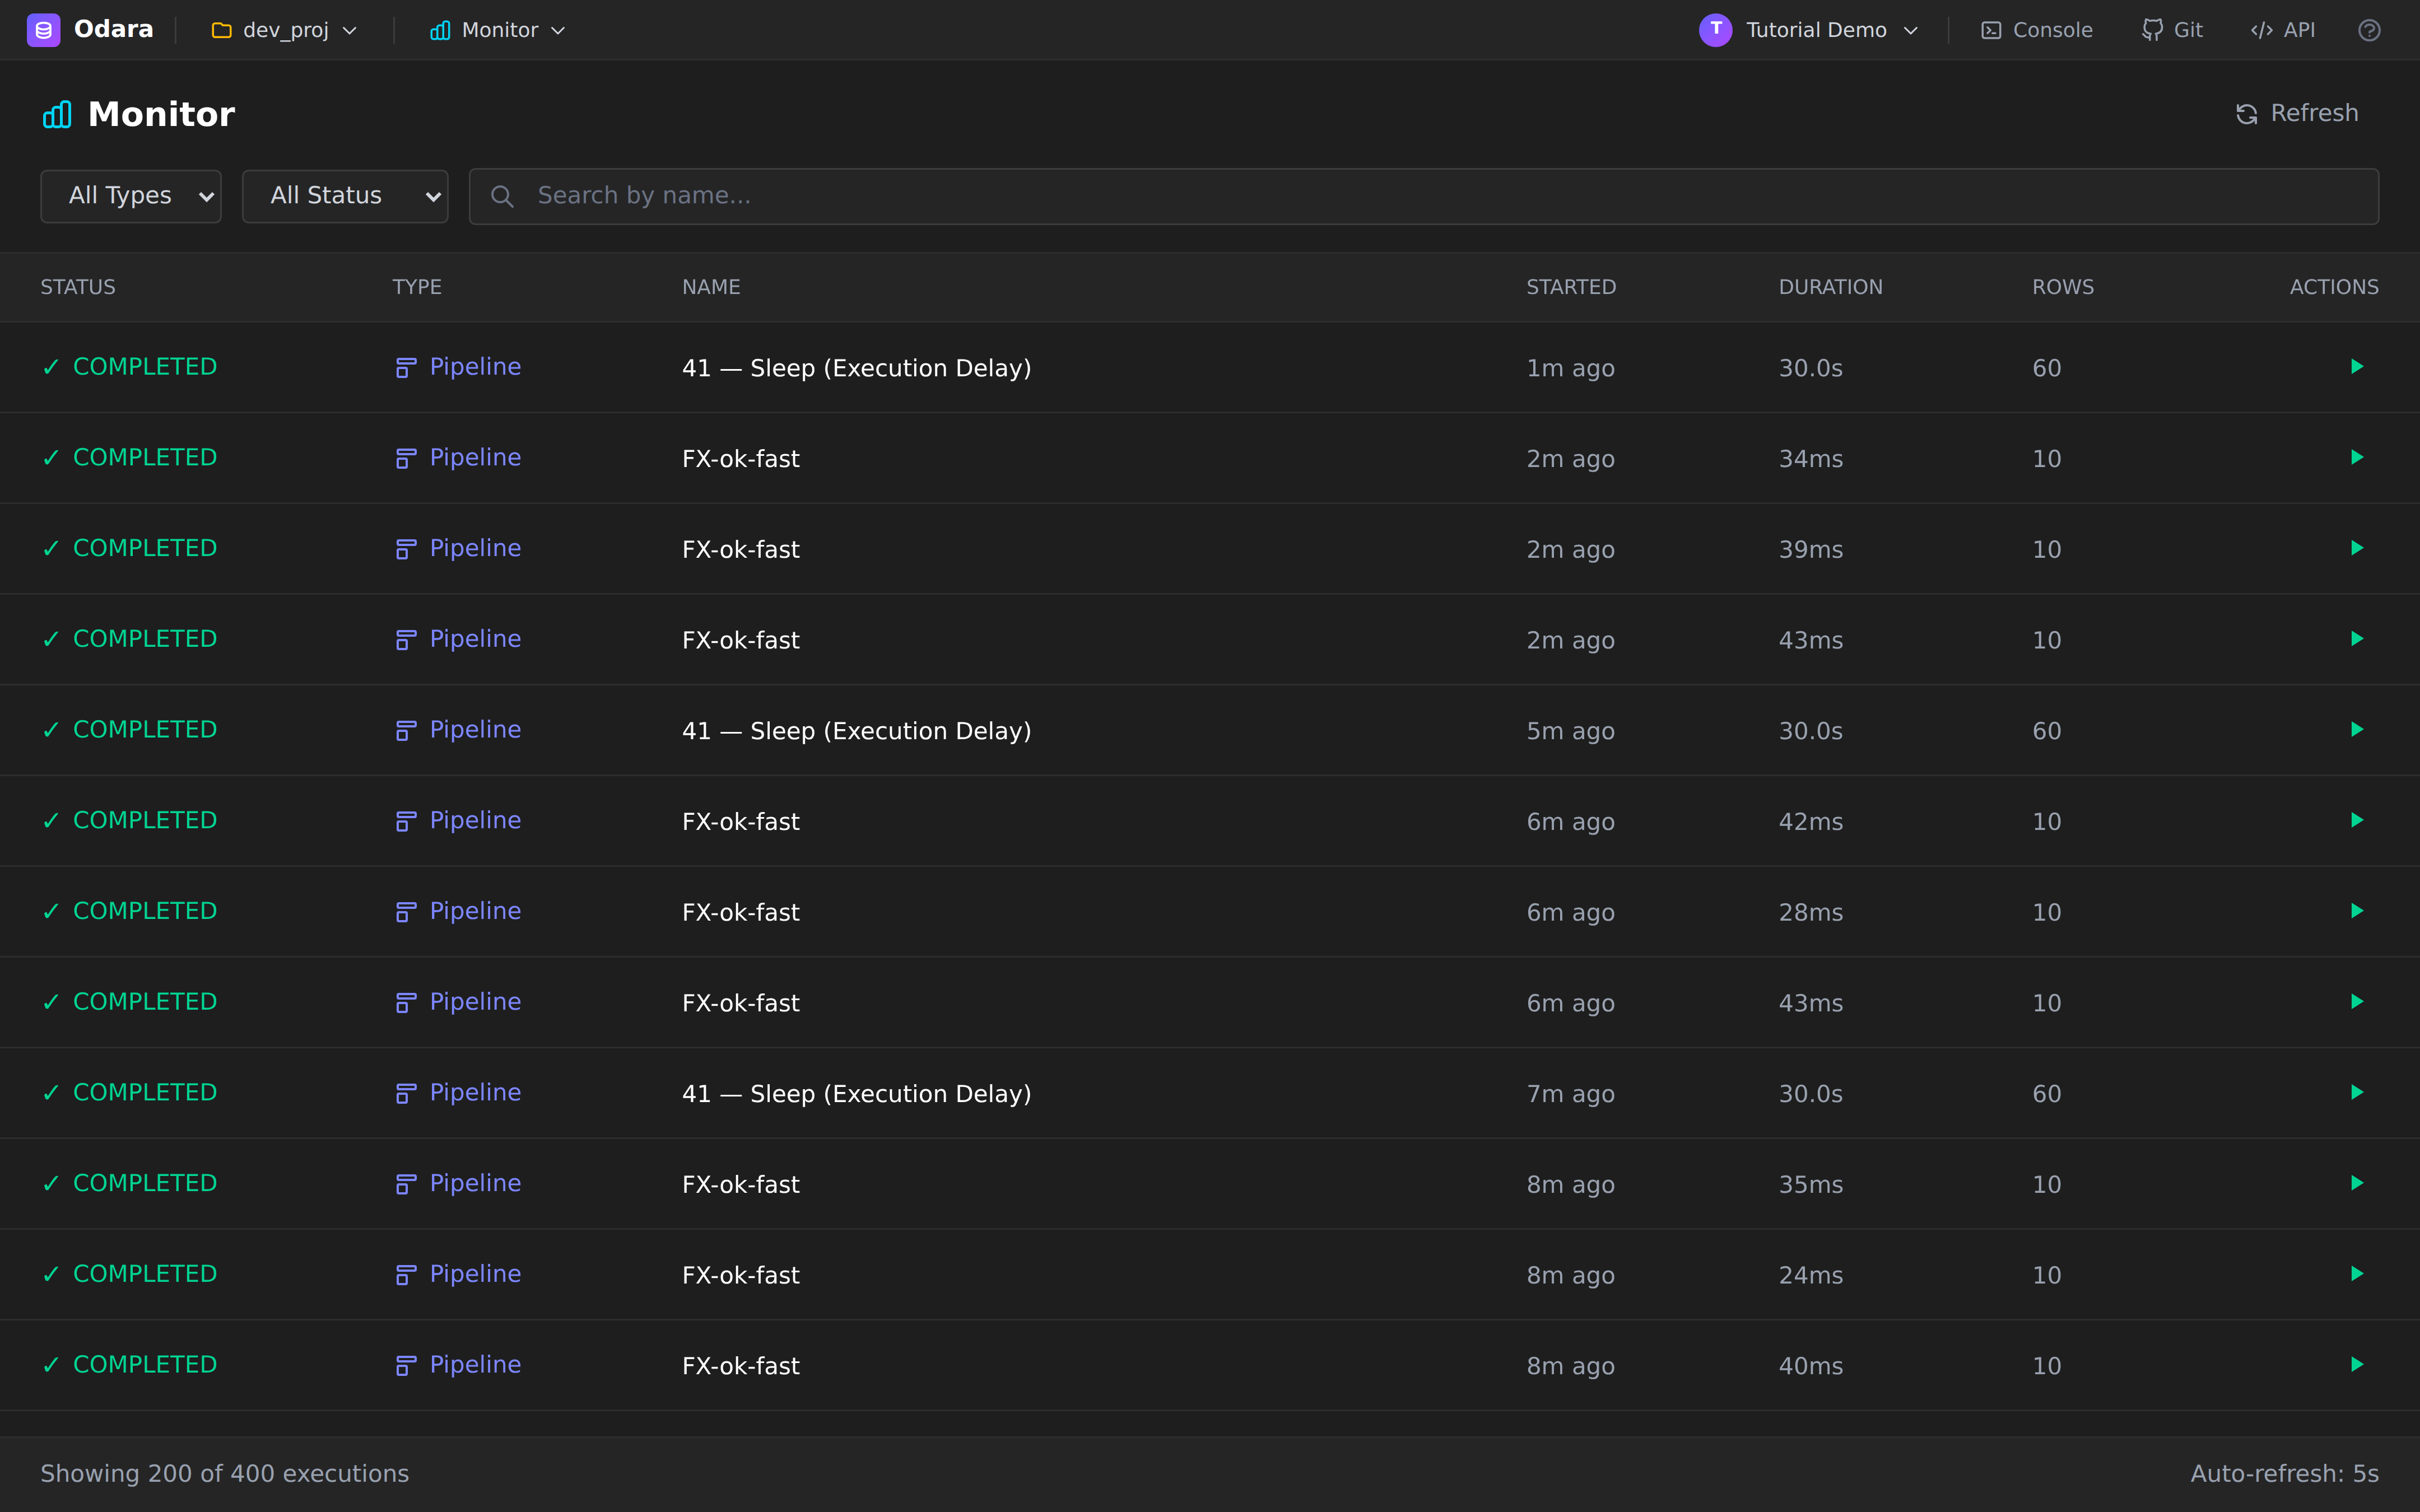
Every row is one run (an execution_id, in the database). The
columns:
| Column | What it means |
|---|---|
| Status | ✓ Completed · ✗ Failed · Running · Stopped · Queued |
| Type | Pipeline or Maestro — a maestro can fan out into N pipelines |
| Name | Pipeline/maestro name. On failed runs, the error message shows below it. |
| Started | Relative time (Just now, 2m ago, 19m ago). |
| Duration | Wall-clock from started_at to completed_at. |
| Rows | Total rows processed by the run. - if nothing was processed (early failure, or no rows). |
| Actions | A green ▶ to re-run the same execution. |
The footer shows two things you should know about:
Showing 200 of 400 executions— the list paginates at 200. Use the filters above to narrow it down.Auto-refresh: 5s— the page polls every 5 seconds. Anything that fires (scheduler, manual run, child of a maestro) shows up here within 5s without a reload.
4. Filter and search
Three controls at the top: All Types, All Status, and a search box that matches the pipeline/maestro name.
By status
The status dropdown is the quickest way to triage. Pick Completed to see only what worked:
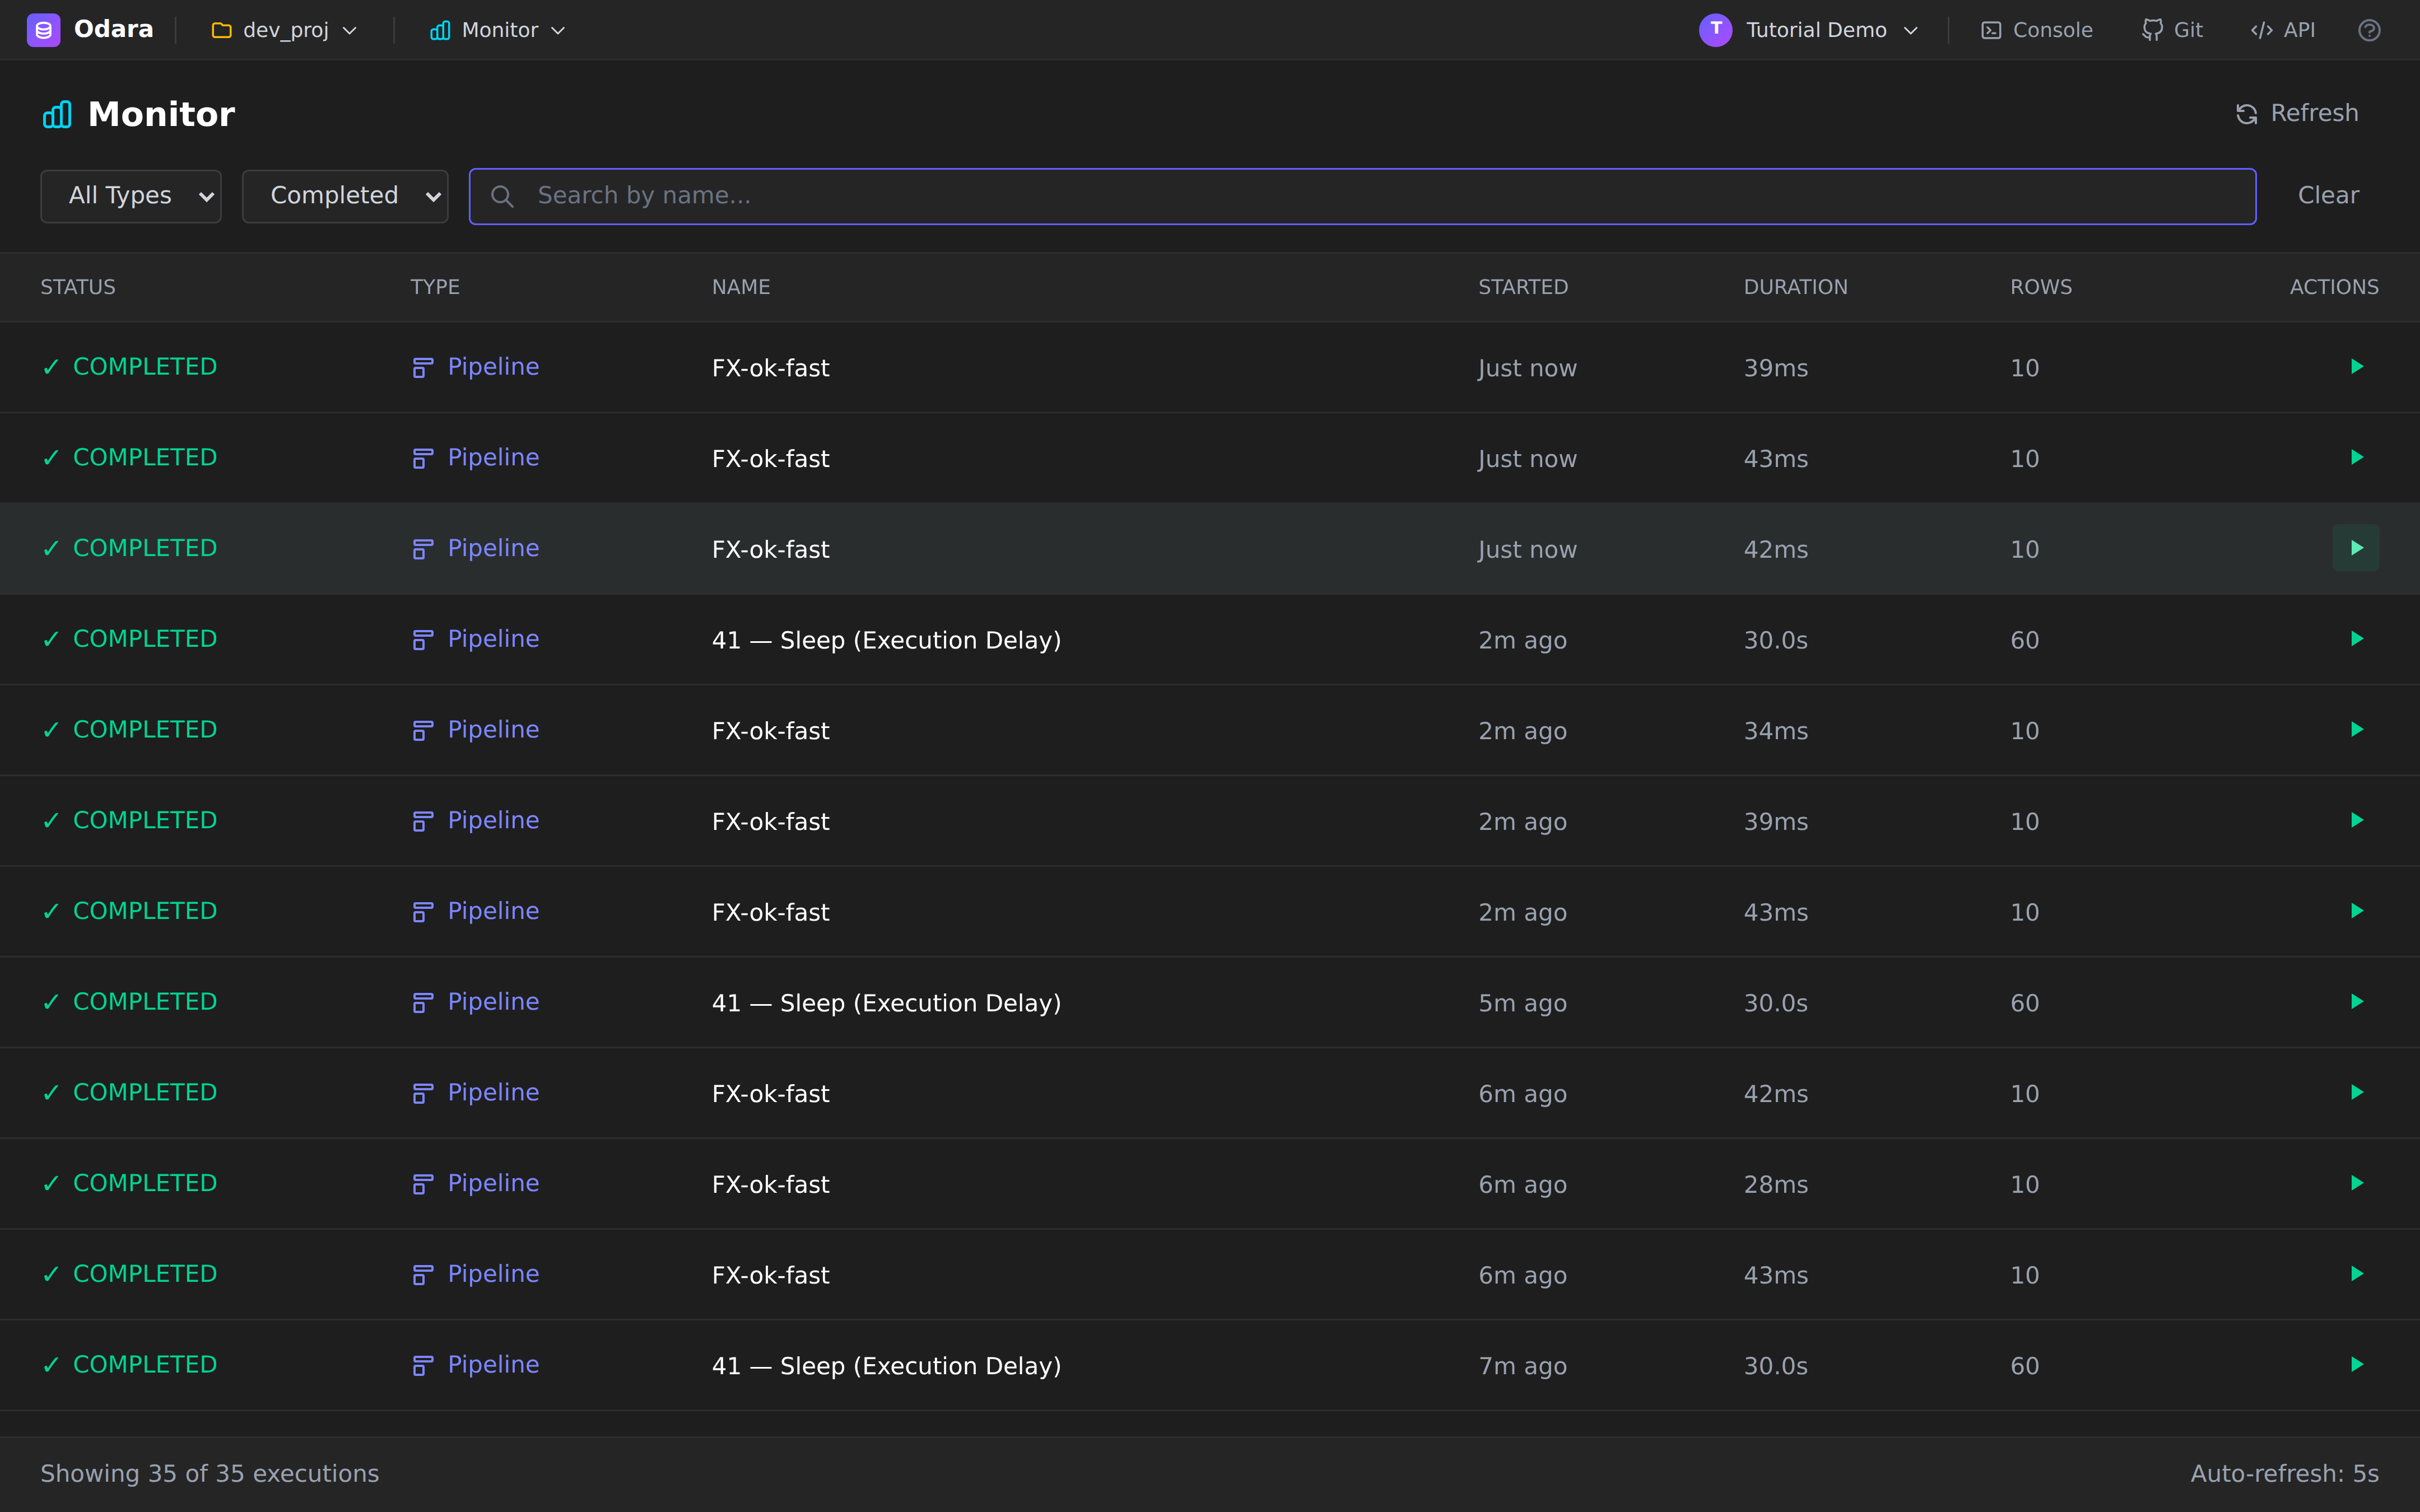
Notice the footer now reads Showing 6 of 6 executions. The dataset
narrowed from 400 down to the runs that match. A Clear button
appears on the right to drop the filter.
By name
Type a fragment of the pipeline name in the search box. Matching is case-insensitive and substring:
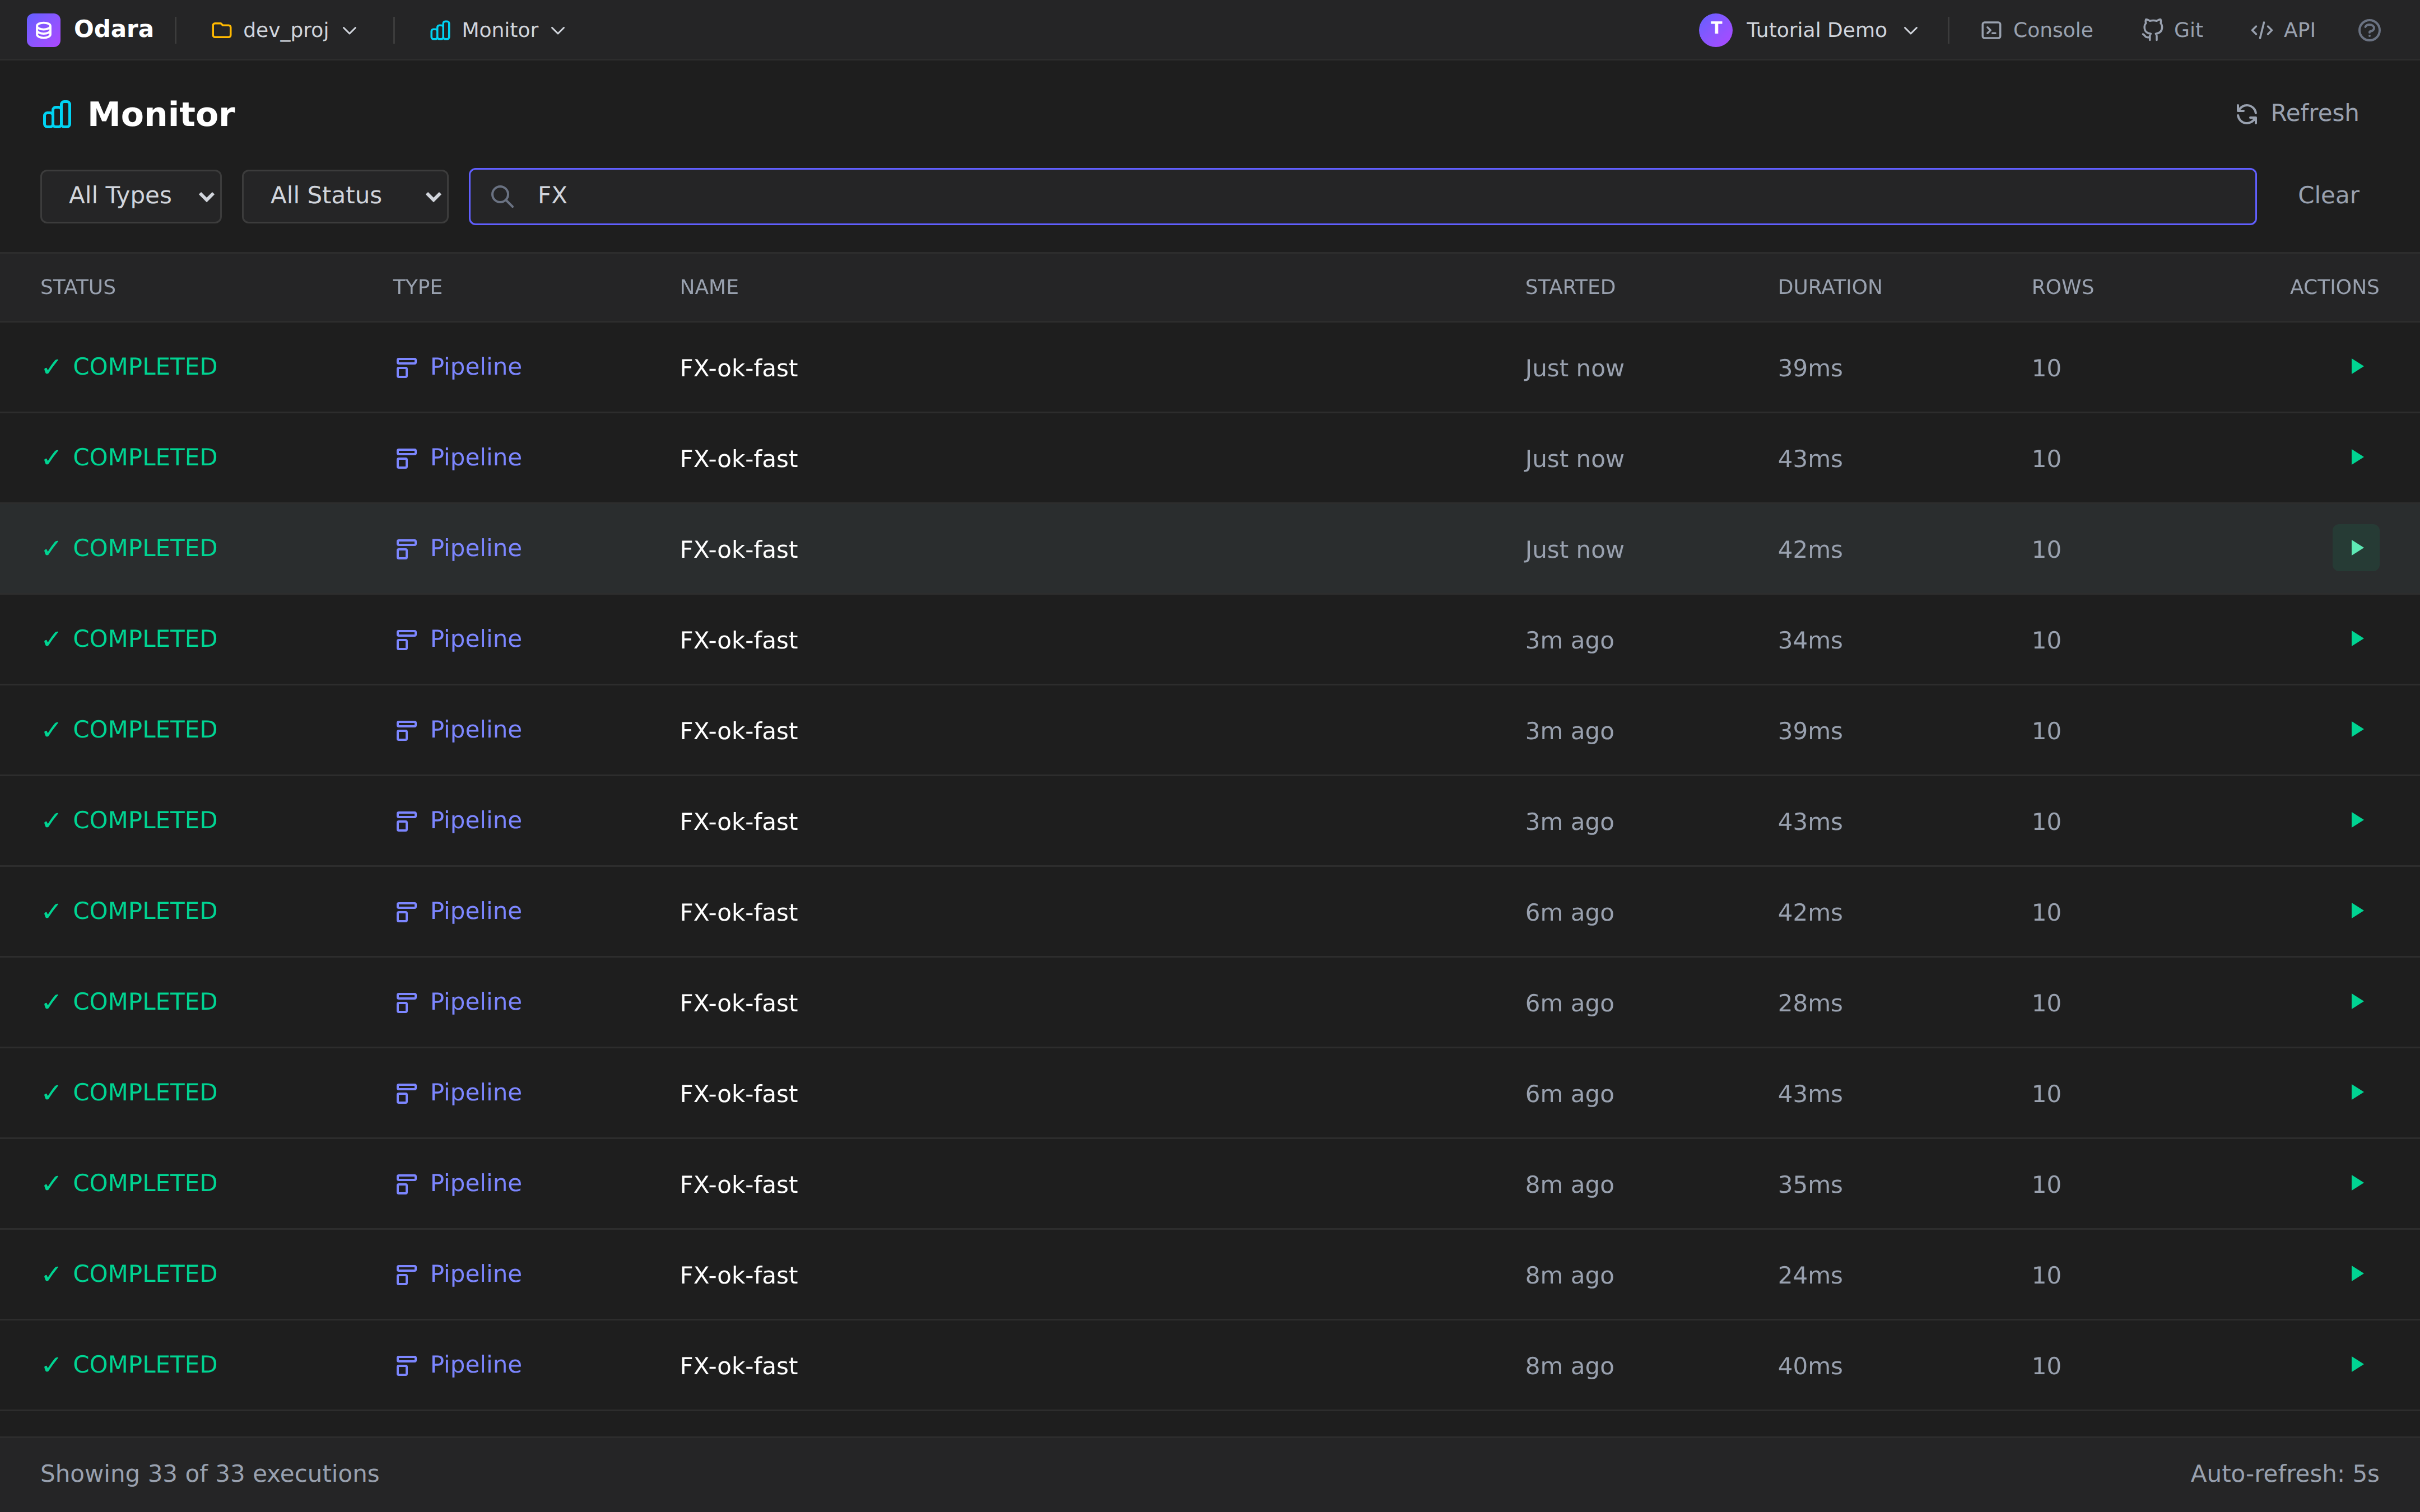
You can combine filters: Type = Pipeline + Status = Failed +
search = customers is a common triage query when something breaks
overnight.
5. Re-run an execution
Every row has a green ▶ in the Actions column. Click it to re-trigger the same pipeline (same config, same inputs) without leaving Monitor.
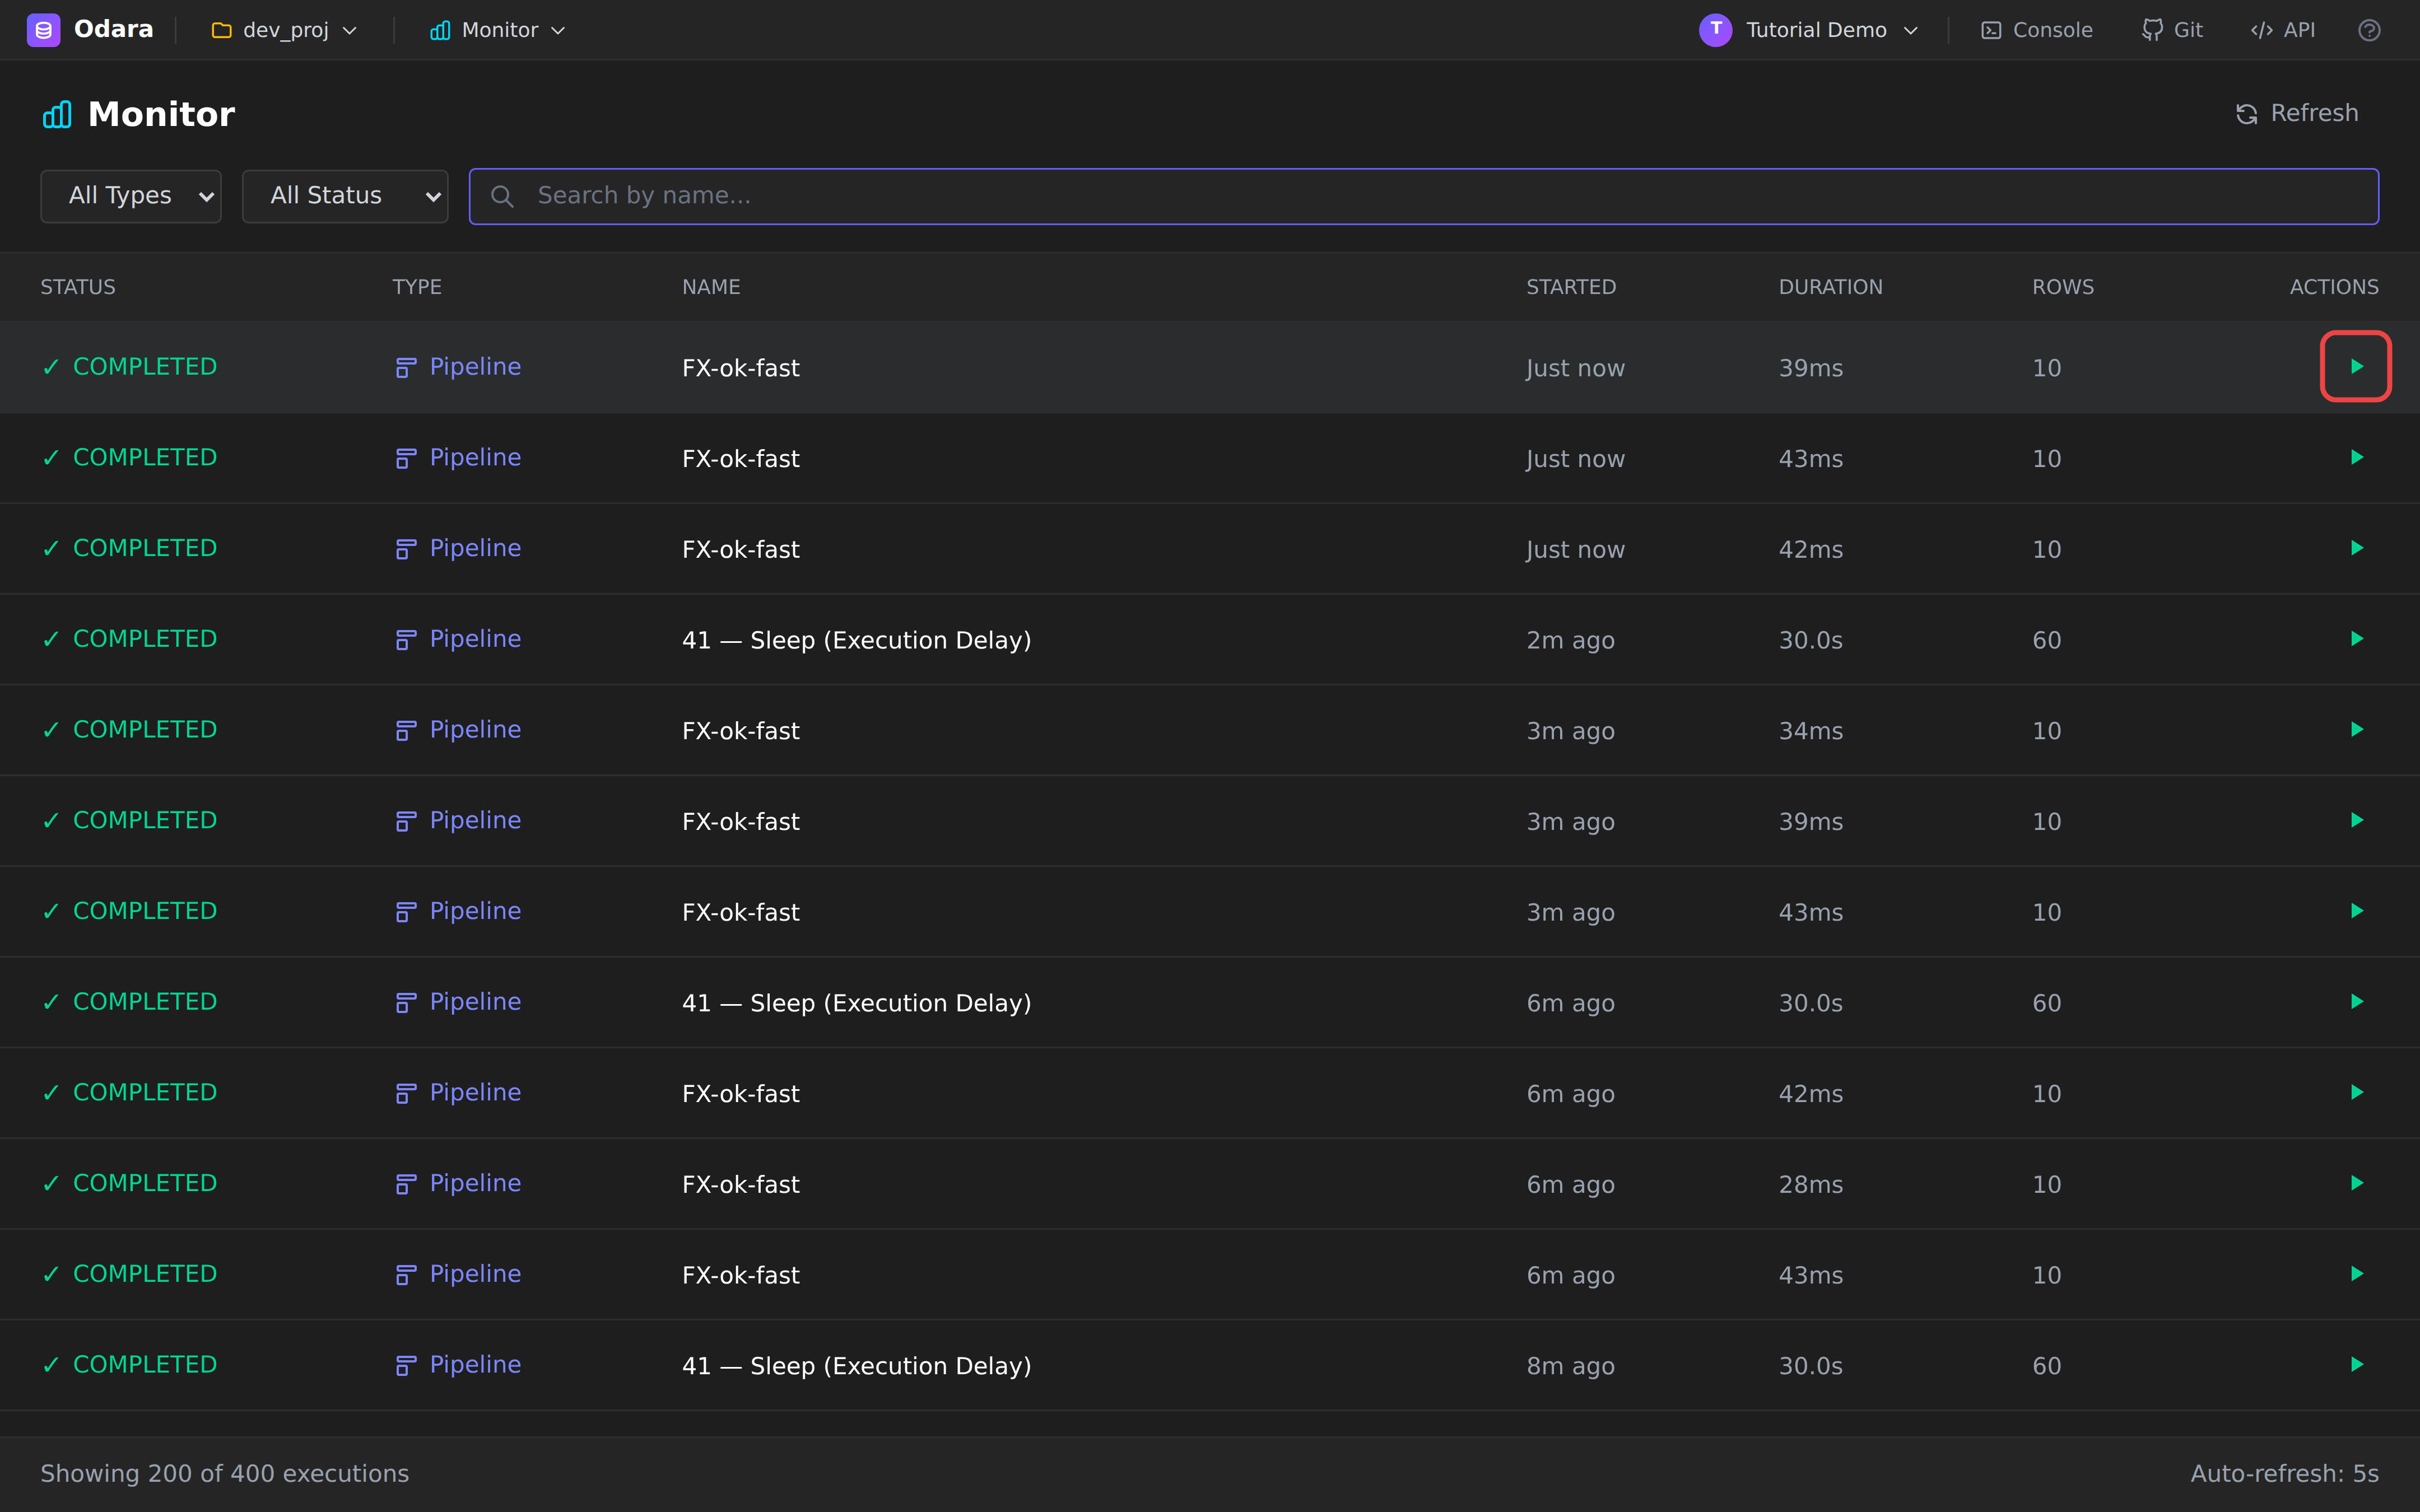
A new row appears at the top of the list within 1-2 seconds. If the run is fast (most ETL pipelines under a few seconds), you'll see it in Just now with its final status almost immediately. If it's a long-running pipeline, you'll see it pass through Running and update on each auto-refresh.
Tip: if a run failed because of a transient issue (network blip, a CSV that wasn't on disk yet), the ▶ button is the fastest way to verify a fix without reopening the Editor.
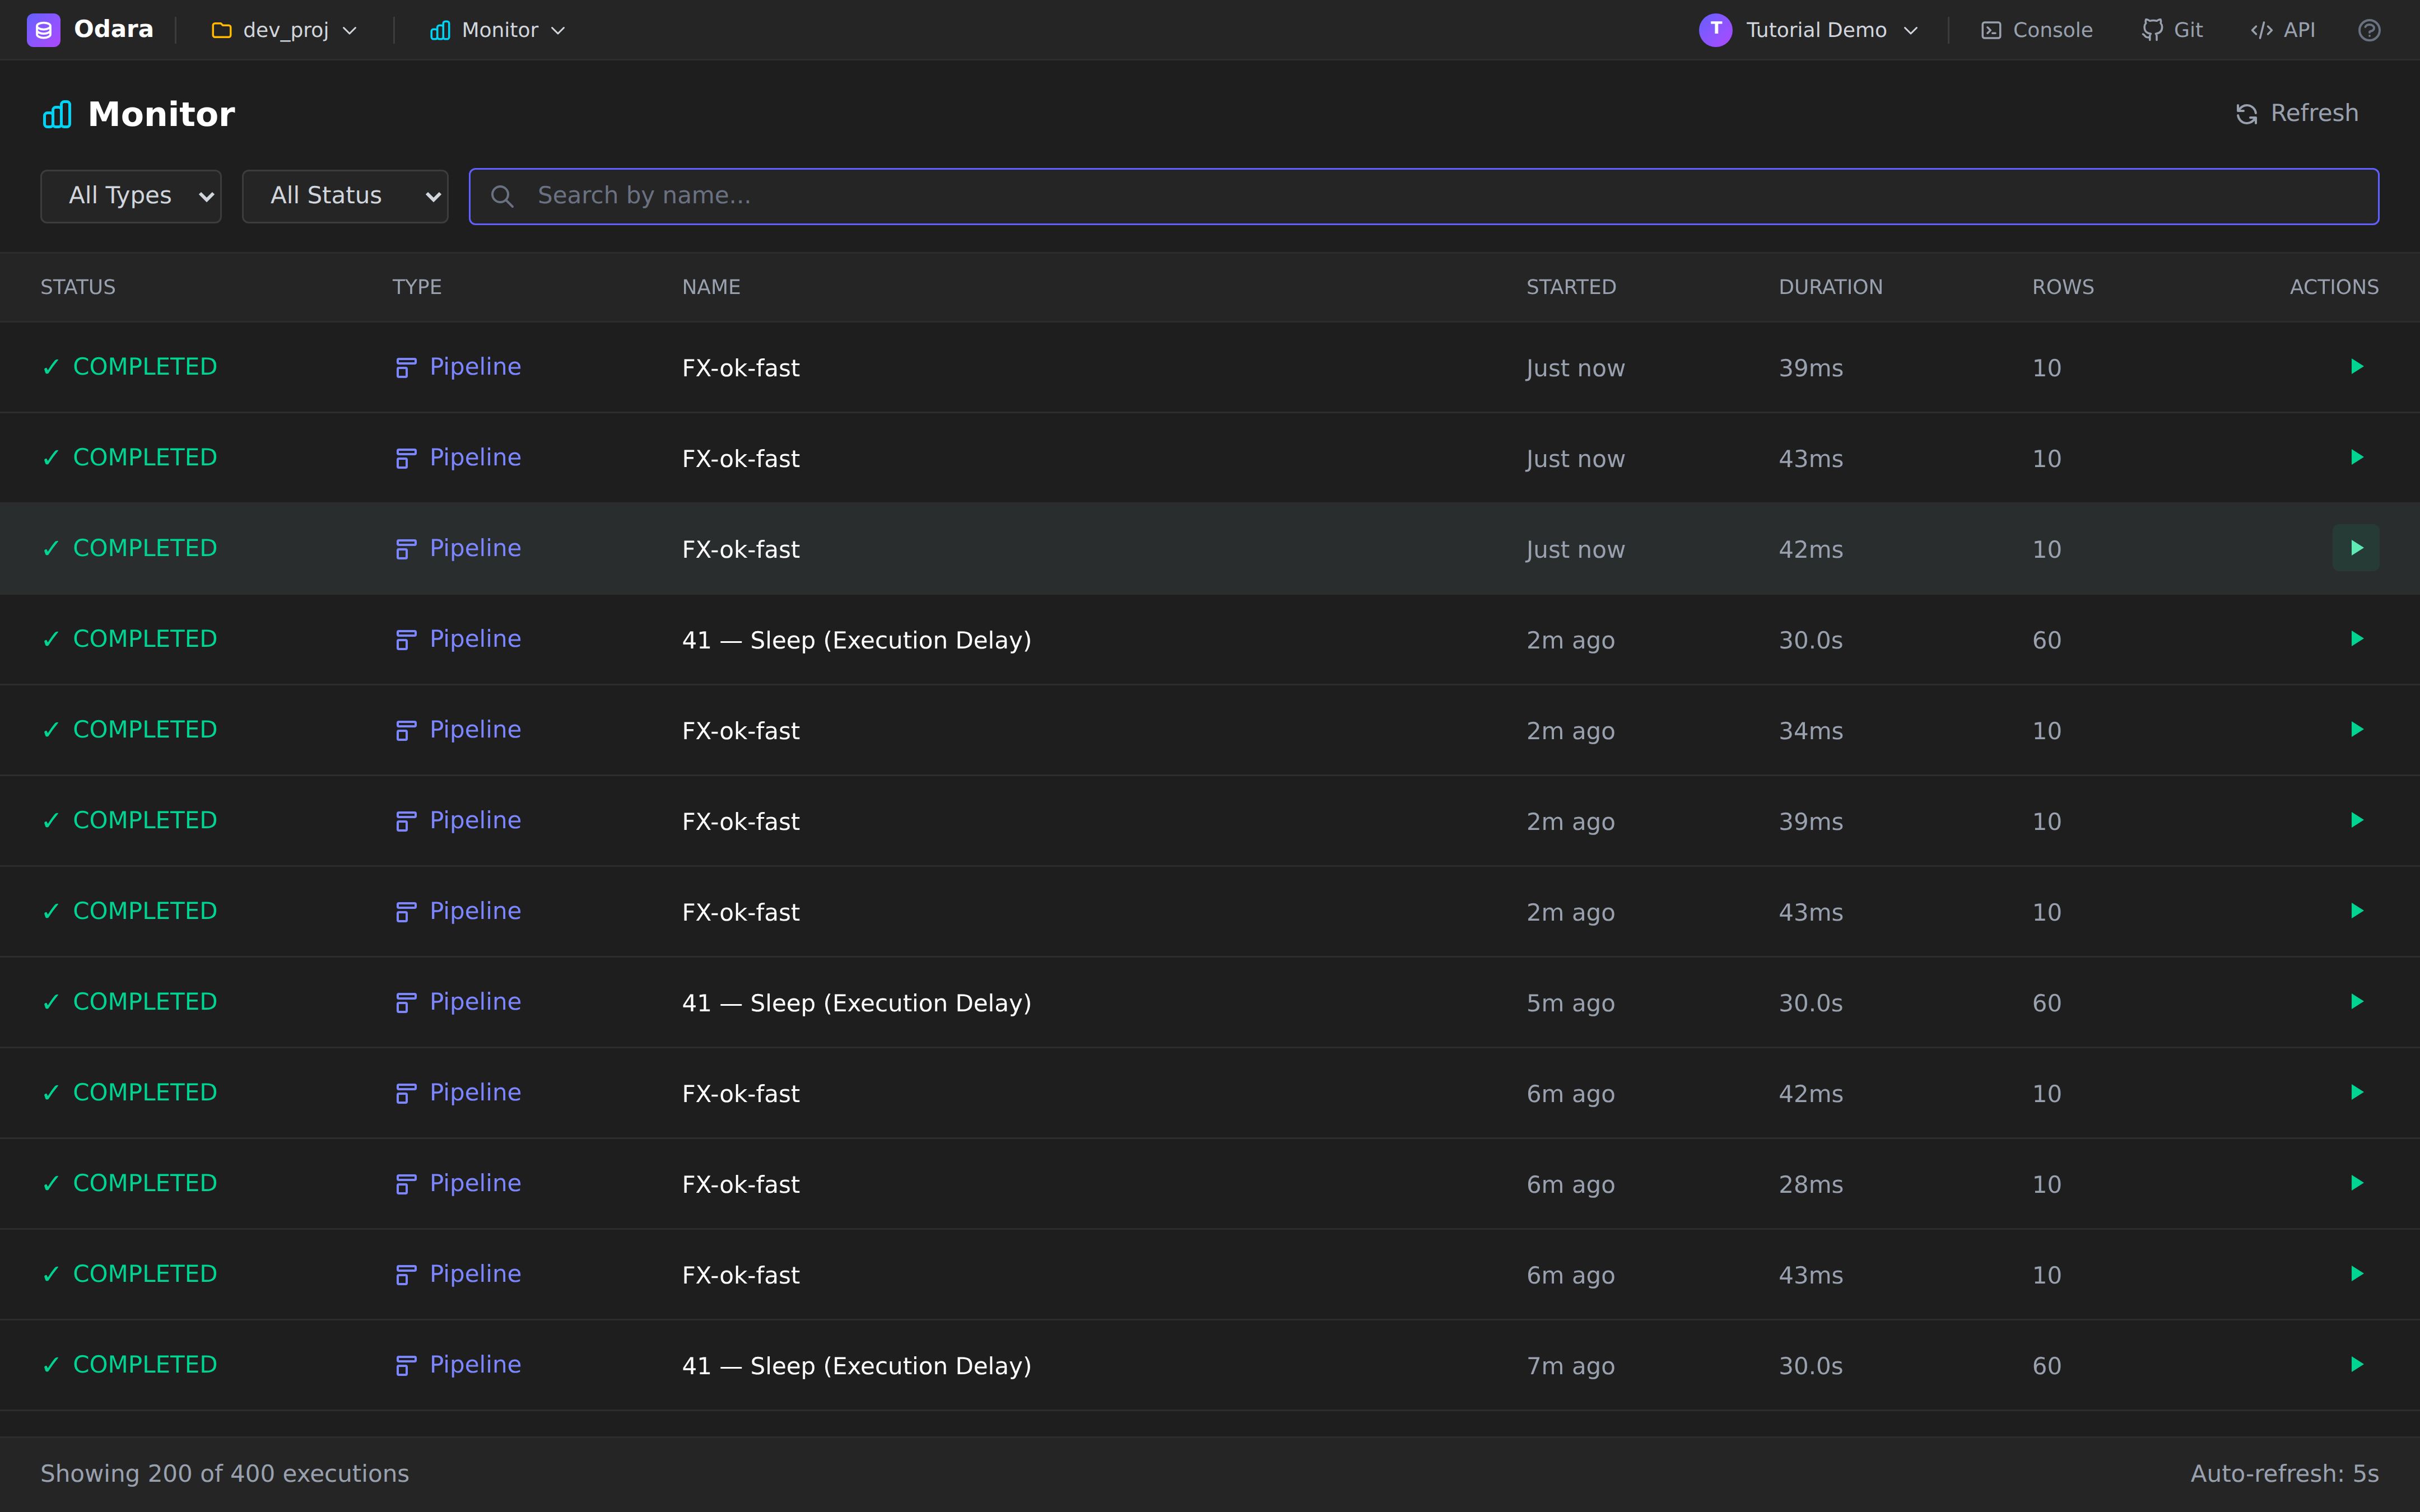
After three re-runs you can see the three fresh COMPLETED rows at
the top, with the old FAILED runs preserved below for history:
6. Open the execution detail — live
Click anywhere on a row (except the ▶ button) to open the detail page for that execution. The most useful moment to open it is while the run is in flight — you get a live cockpit of the engine.
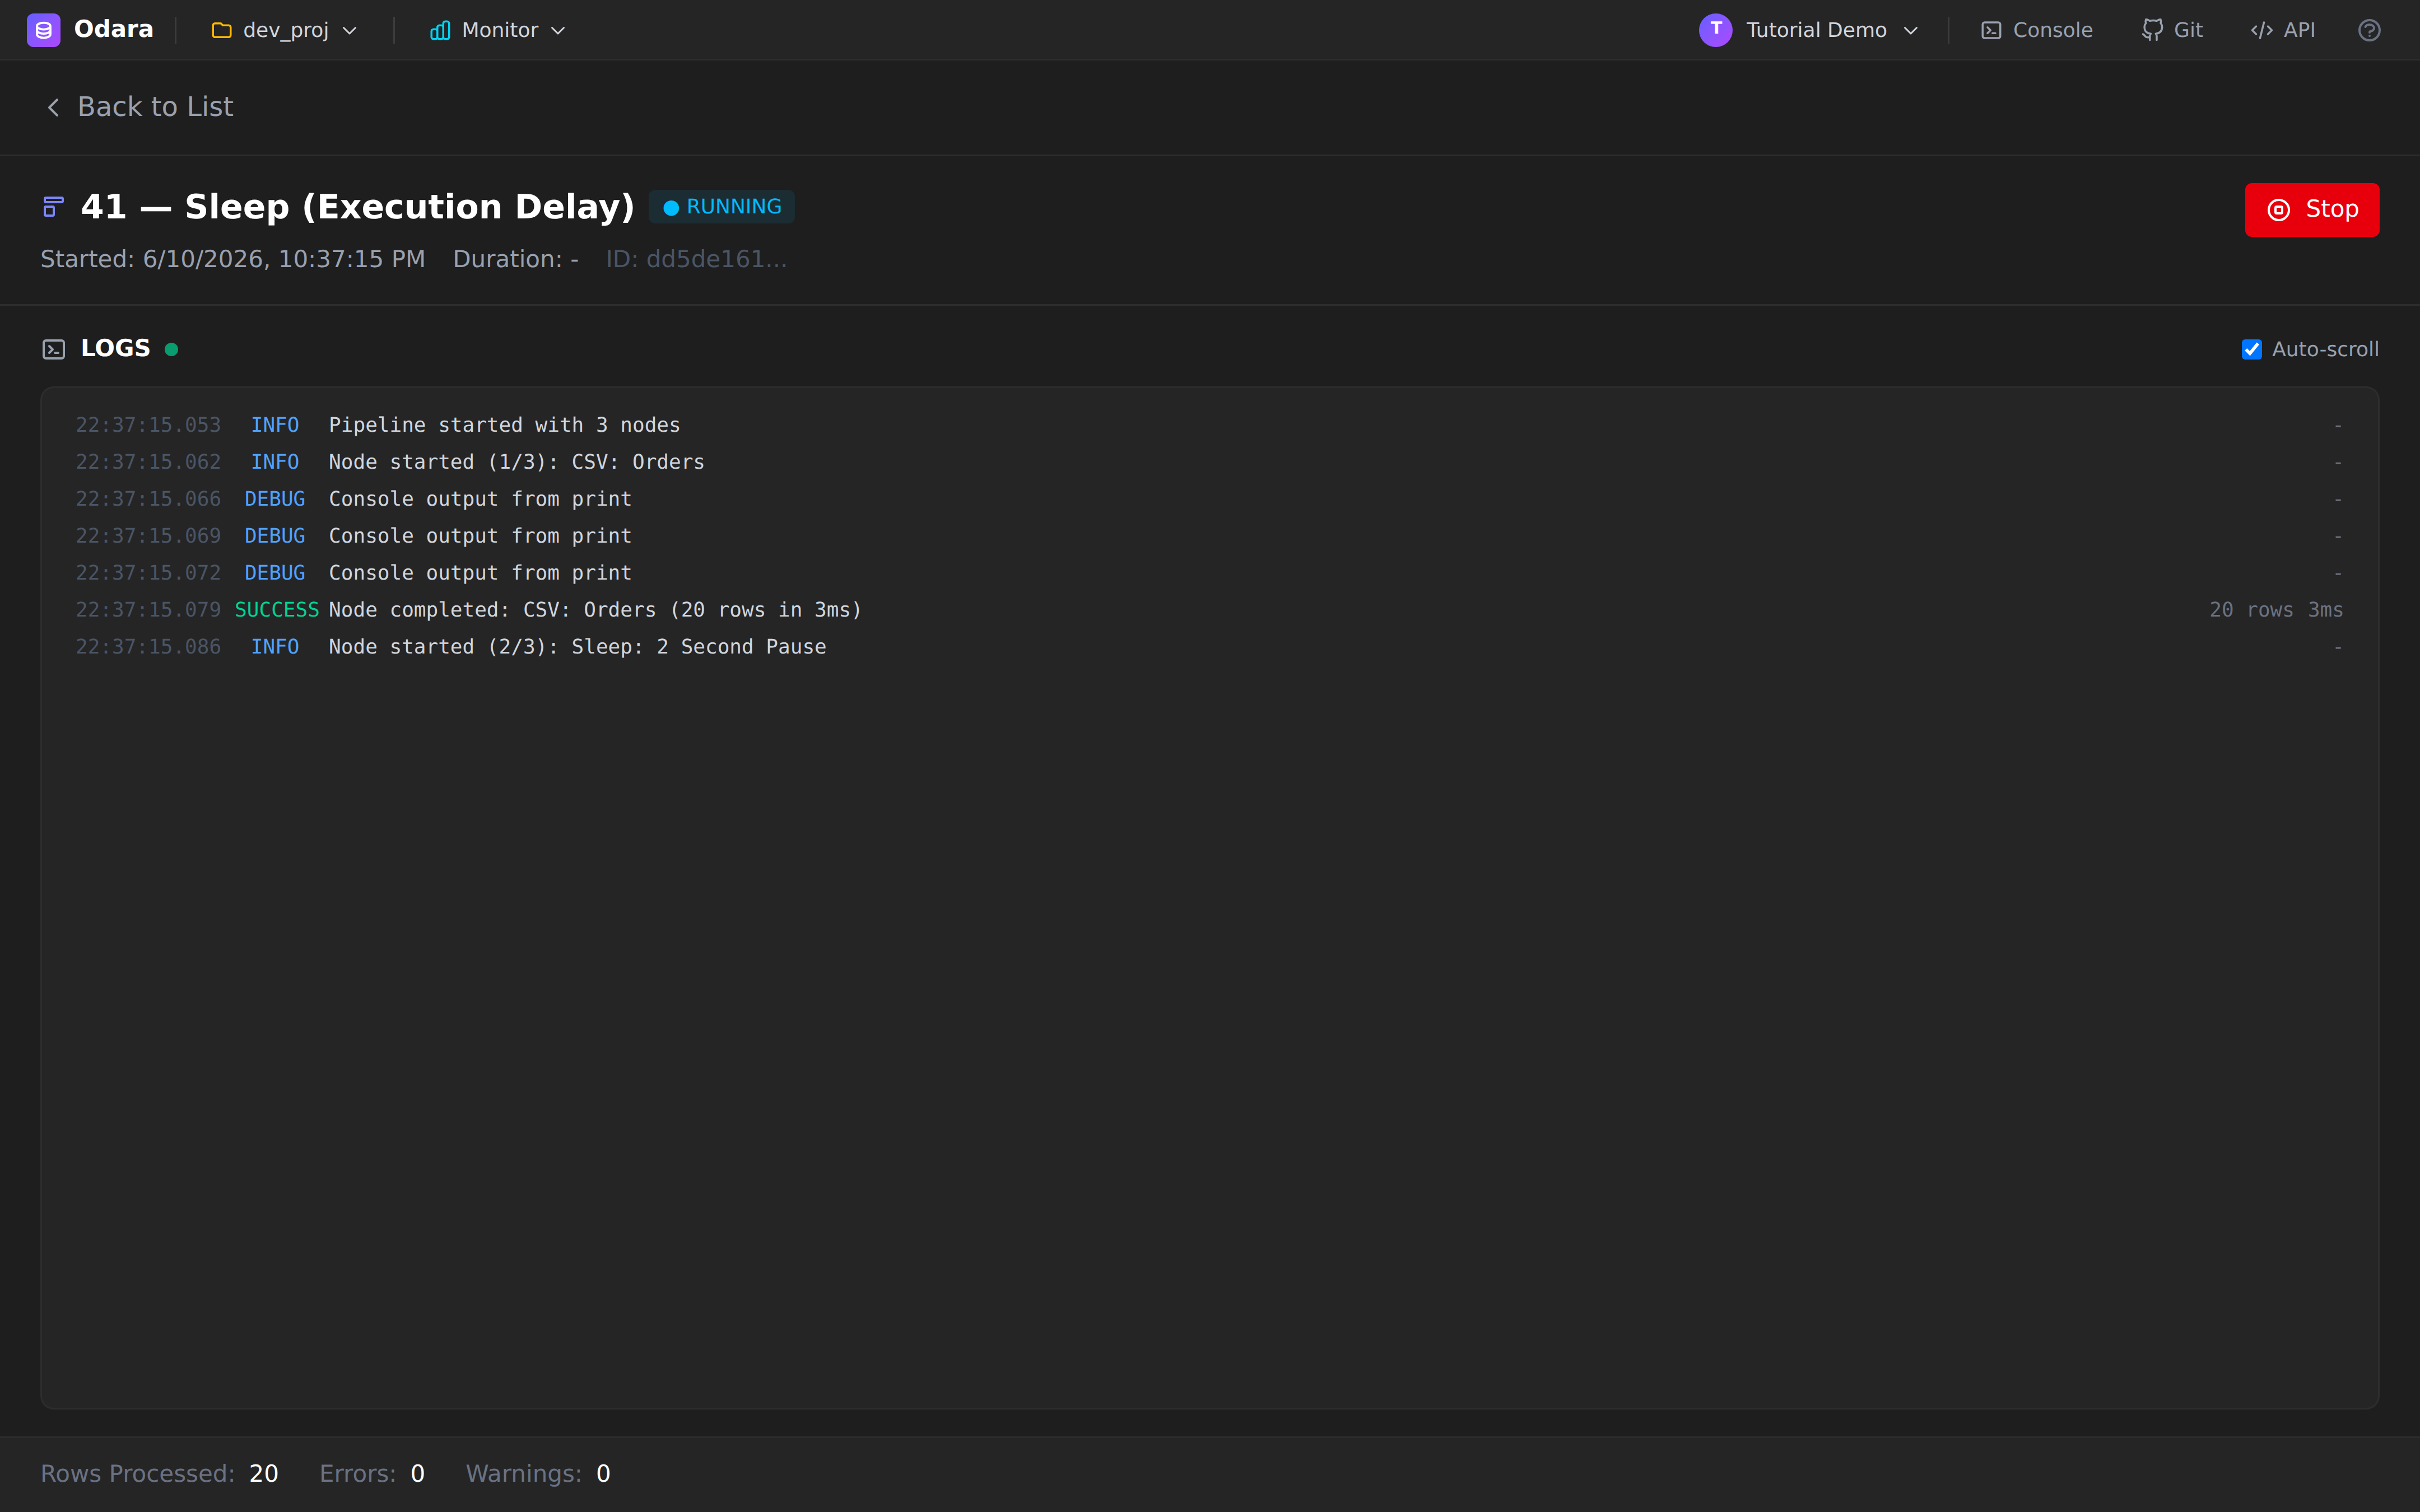
The header gives you the essentials:
- Pipeline name and status badge (blue RUNNING, green COMPLETED, or red FAILED)
- Started — full timestamp, not relative
- Duration — wall-clock, ticks up while RUNNING and freezes at the final value once the run ends
- Execution ID — a UUID; copy it if you need to grep the API logs
- Stop button on the right — red while RUNNING, grey Stopped once the run is over; clicking it cancels via the abort endpoint
The LOGS panel streams the per-node log lines from the engine
in real time. Each row has a timestamp, level (INFO, DEBUG,
SUCCESS), the originating node name, and the message. The little
green dot next to the LOGS title pulses while the stream is
attached.
At the bottom of the page three counters tick up as the run progresses: Rows Processed, Errors, Warnings.
7. Re-open after completion
When the run finishes, the detail page does not auto-refresh from RUNNING to COMPLETED — it keeps showing the snapshot from when you opened it. To see the final state, click ← Back to List and then click the row again. Odara re-fetches the row from the persistent store, so the second visit shows the final status and the complete log history:
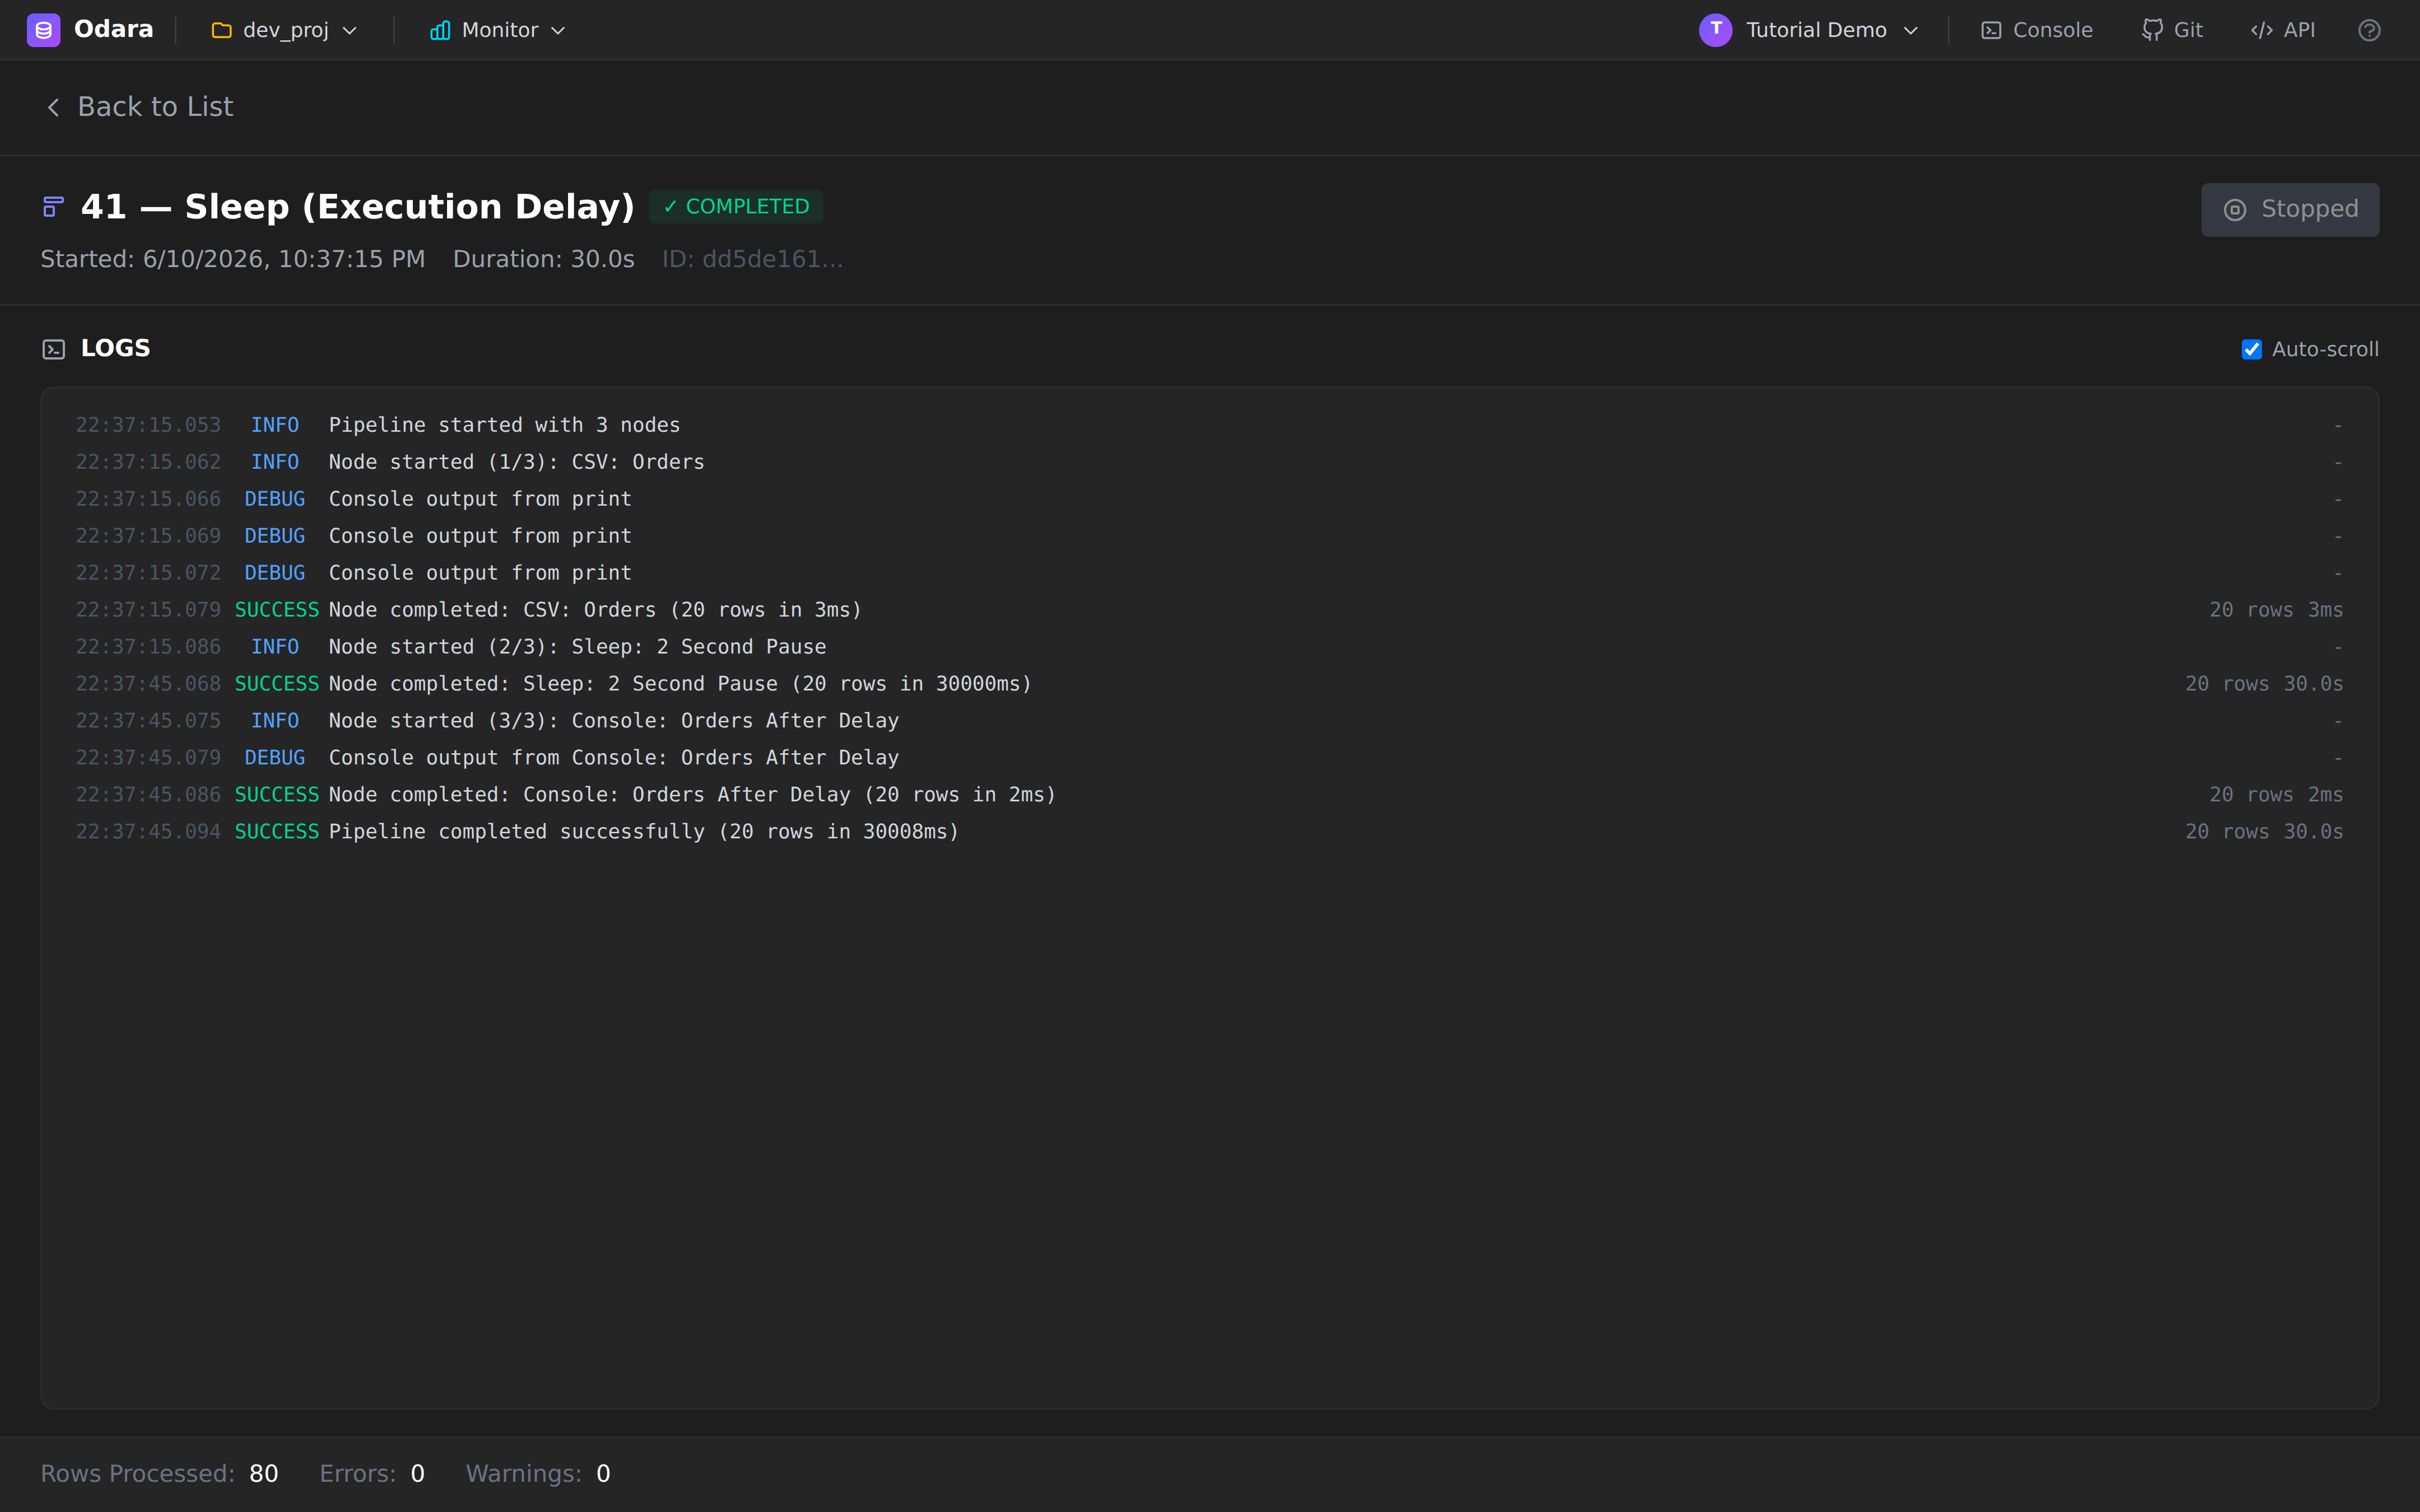
What changed compared with the live view:
- Status is now COMPLETED (or FAILED), the Stop button becomes Stopped and is greyed out.
- Duration is final —
30.0sin the screenshot above. - The LOGS panel shows the whole trace: pipeline start, every
node's start/finish lines, the
SUCCESS Pipeline completed successfully (N rows in Nms)footer. - Per-node row-counts and timings appear on the right of each
SUCCESSline (e.g.20 rows · 30000ms) — handy for spotting the slowest stage at a glance.
Failed runs
For a ✗ FAILED row the layout is identical, just with a red
status badge. The LOGS panel will hold the last lines emitted
before the failure, including the error message and which node
raised it. Rows Processed can be 0 (engine failed before
reading the source) or > 0 (target writes succeeded, then a later
write blew up) — both are common.
What's next
- Schedule — set a pipeline or maestro to run on a cron and have alerts emailed on failure. (See the Schedule tutorial.)
- Admin — manage connections, projects, and users. (See the Admin tutorial.)
Cheat sheet
| Action | How |
|---|---|
| Open Monitor | Header → Editor ▼ → Monitor |
| Triage failures | Status filter → Failed |
| Find one pipeline | Search box (substring, case-insensitive) |
| Re-run | Green ▶ on the row |
| See execution metadata | Click the row |
| See live logs | Open detail while it's running |
| See the full log of a finished run | Back to List → click the row again |
| Cancel a running execution | Detail page → Stop button (red) |
| Refresh | Auto every 5s, or Refresh top-right |