AI Assistant → Python
One line: describe an enrichment in plain English and the AI Assistant builds the whole pipeline — CSV in, a pandas transform (quartiles, z-score outliers, a derived label), and an Excel file out.
This is the Python companion to the SQL walkthrough. Same Compose flow, but this time the AI reaches for things SQL is clumsy at — statistical bucketing and outlier detection — and writes them in Python with pandas/numpy/scipy. Reading time 12 minutes.
By the end you will know how to:
- Use Compose to generate a Python-based pipeline from one prompt
- Read the AI's plan and apply it to the canvas
- Review the generated pandas code (and what to check before trusting it)
- Run it and verify the enriched Excel output
Files
Download this into a local folder (example path
/tmp/tutorials/ai-python/):
- orders.csv — 600 orders (
order_id,customer,amount,order_date) with a few deliberate high-value outliers so the z-score logic has something to find.
Prereq: Python transforms run in Odara's Python subprocess. This example uses pandas, numpy and scipy — all present in a standard Odara install. If a generated transform imports a package you don't have, see the note in §4.
1. Describe the pipeline
Create a new pipeline, open AI Assistant (sidebar footer), stay in Compose mode, and type the goal. (If you haven't configured a provider yet, do step 2 of the SQL walkthrough first.)
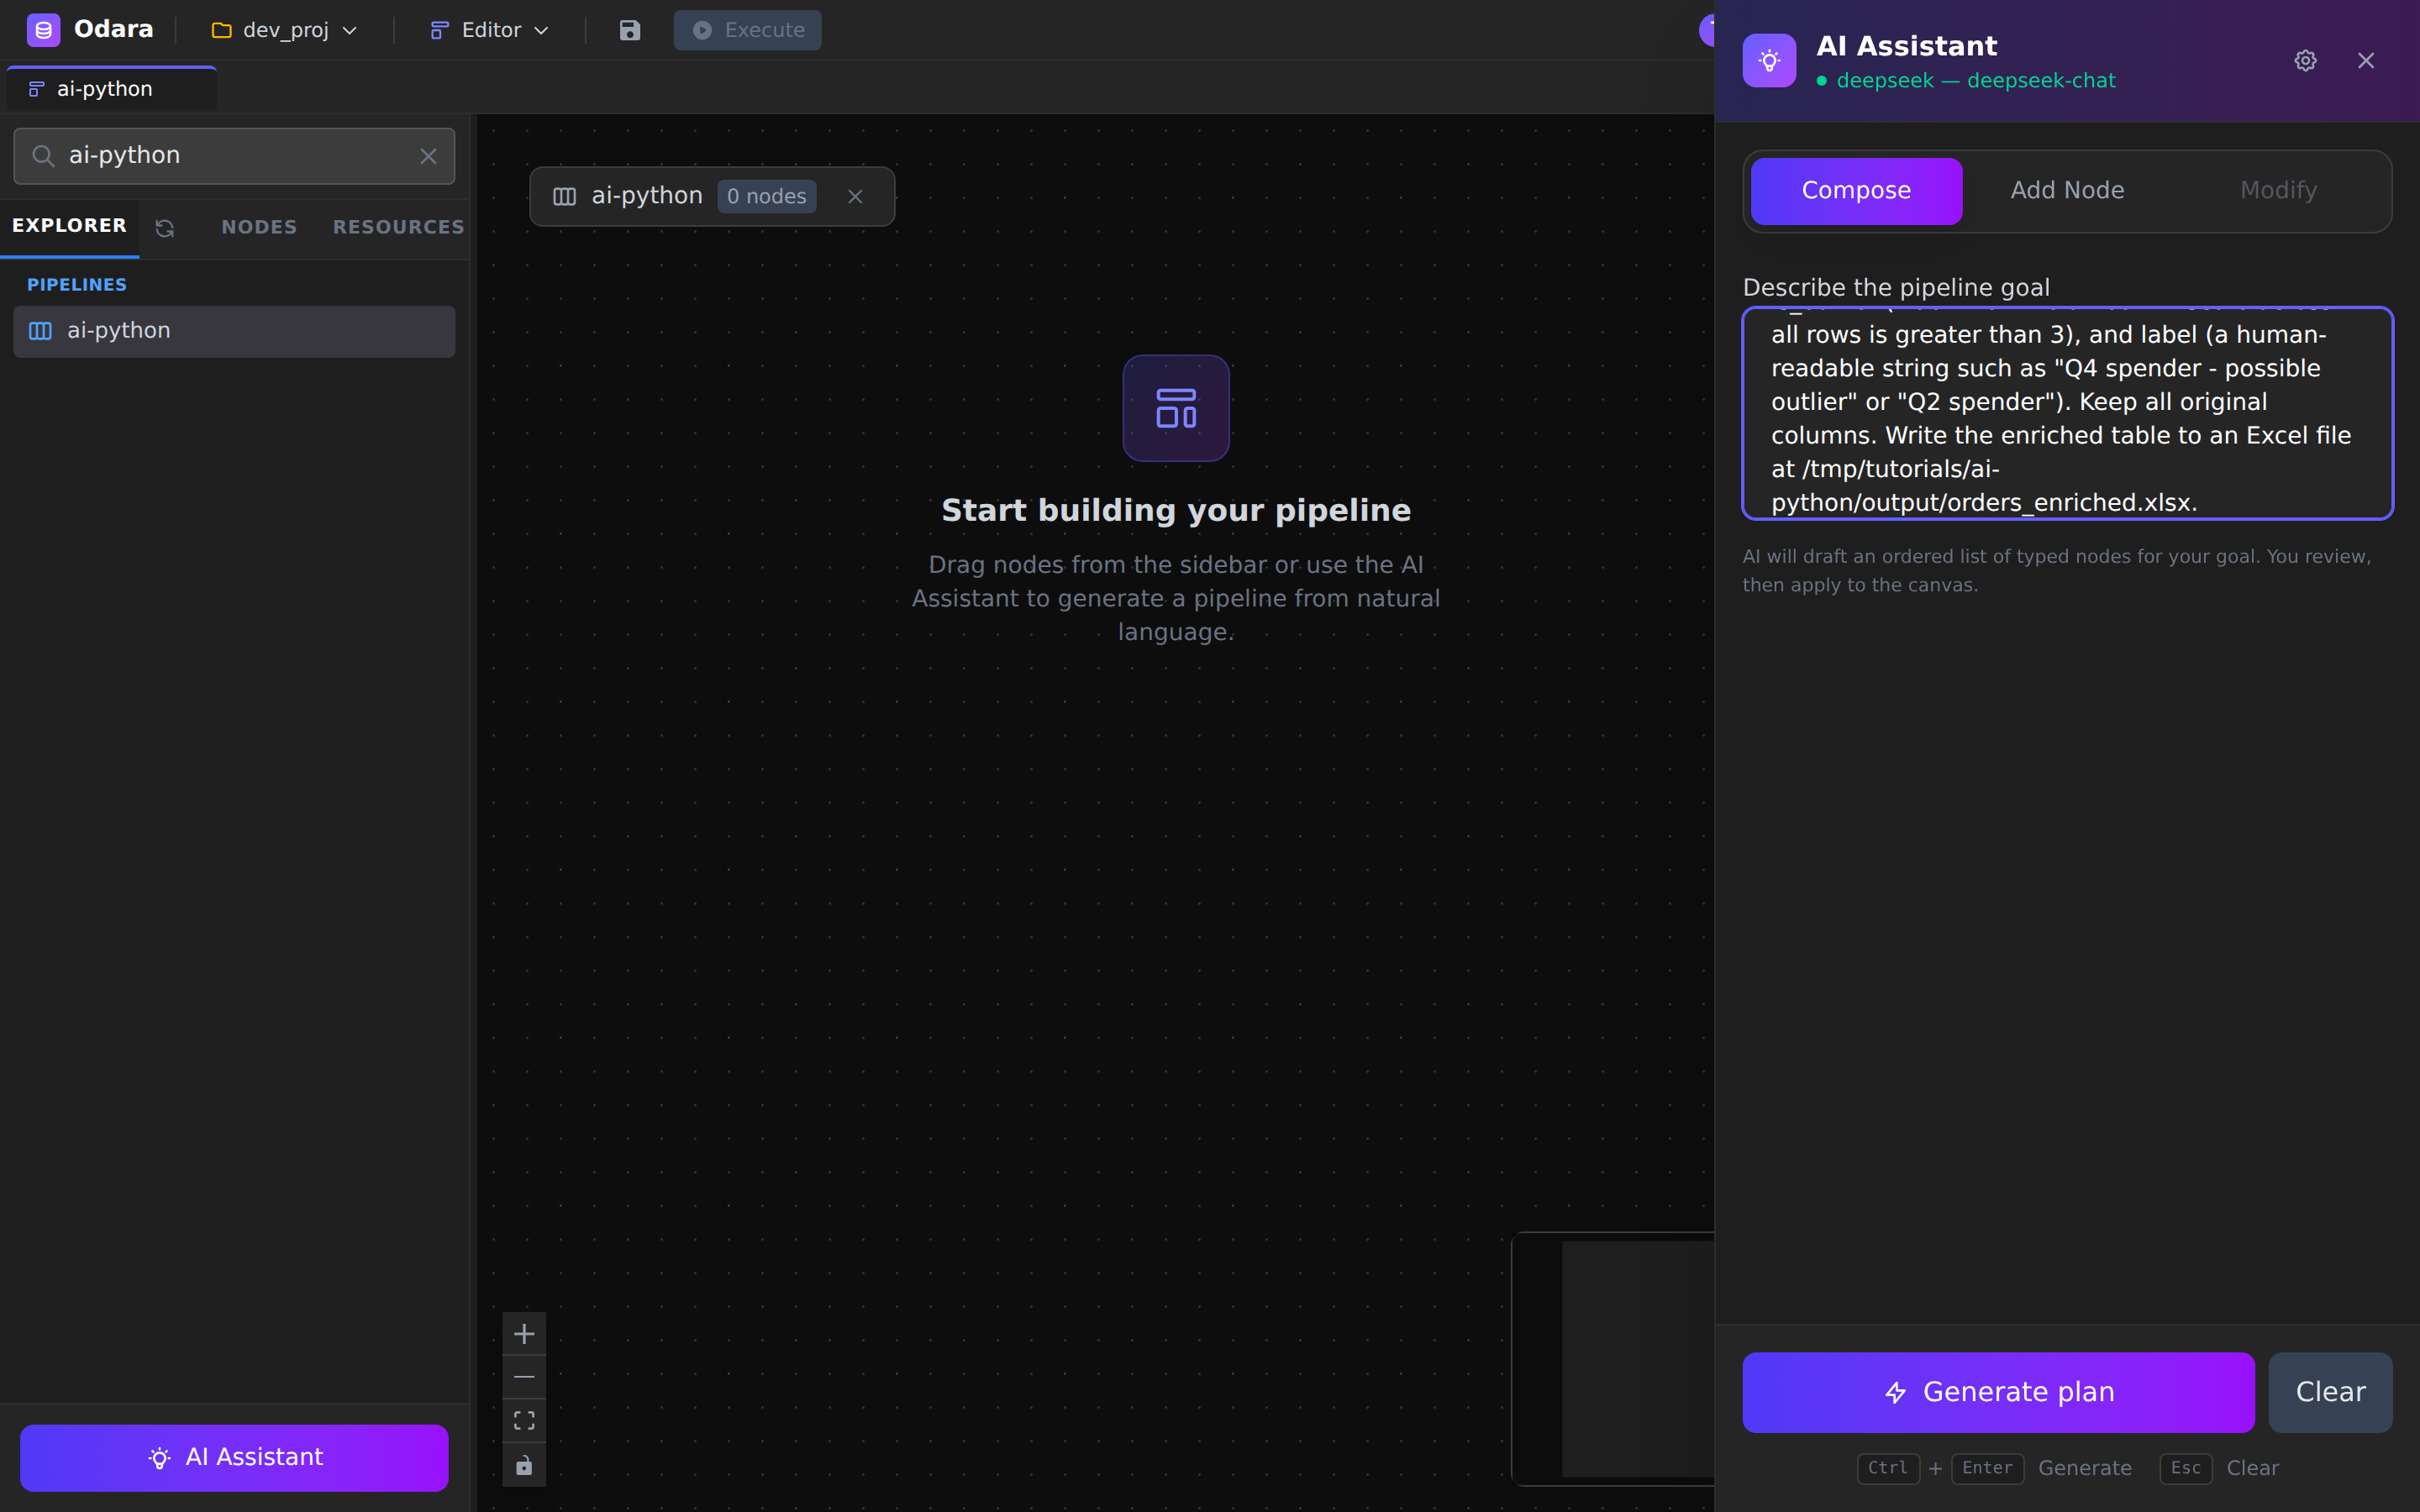
Read orders from the CSV file at /tmp/tutorials/ai-python/orders.csv
(columns: order_id, customer, amount, order_date). Using a Python
transform with pandas, add three new columns: spend_tier (the quartile
bucket of amount labelled Q1 to Q4), is_outlier (true when the amount
z-score across all rows is greater than 3), and label (a human-readable
string such as "Q4 spender - possible outlier" or "Q2 spender"). Keep all
original columns. Write the enriched table to an Excel file at
/tmp/tutorials/ai-python/output/orders_enriched.xlsx.
Notice we explicitly asked for Python ("Using a Python transform with
pandas") — that nudges the AI to a python_transform instead of SQL.
Click Generate plan.
2. Review the plan
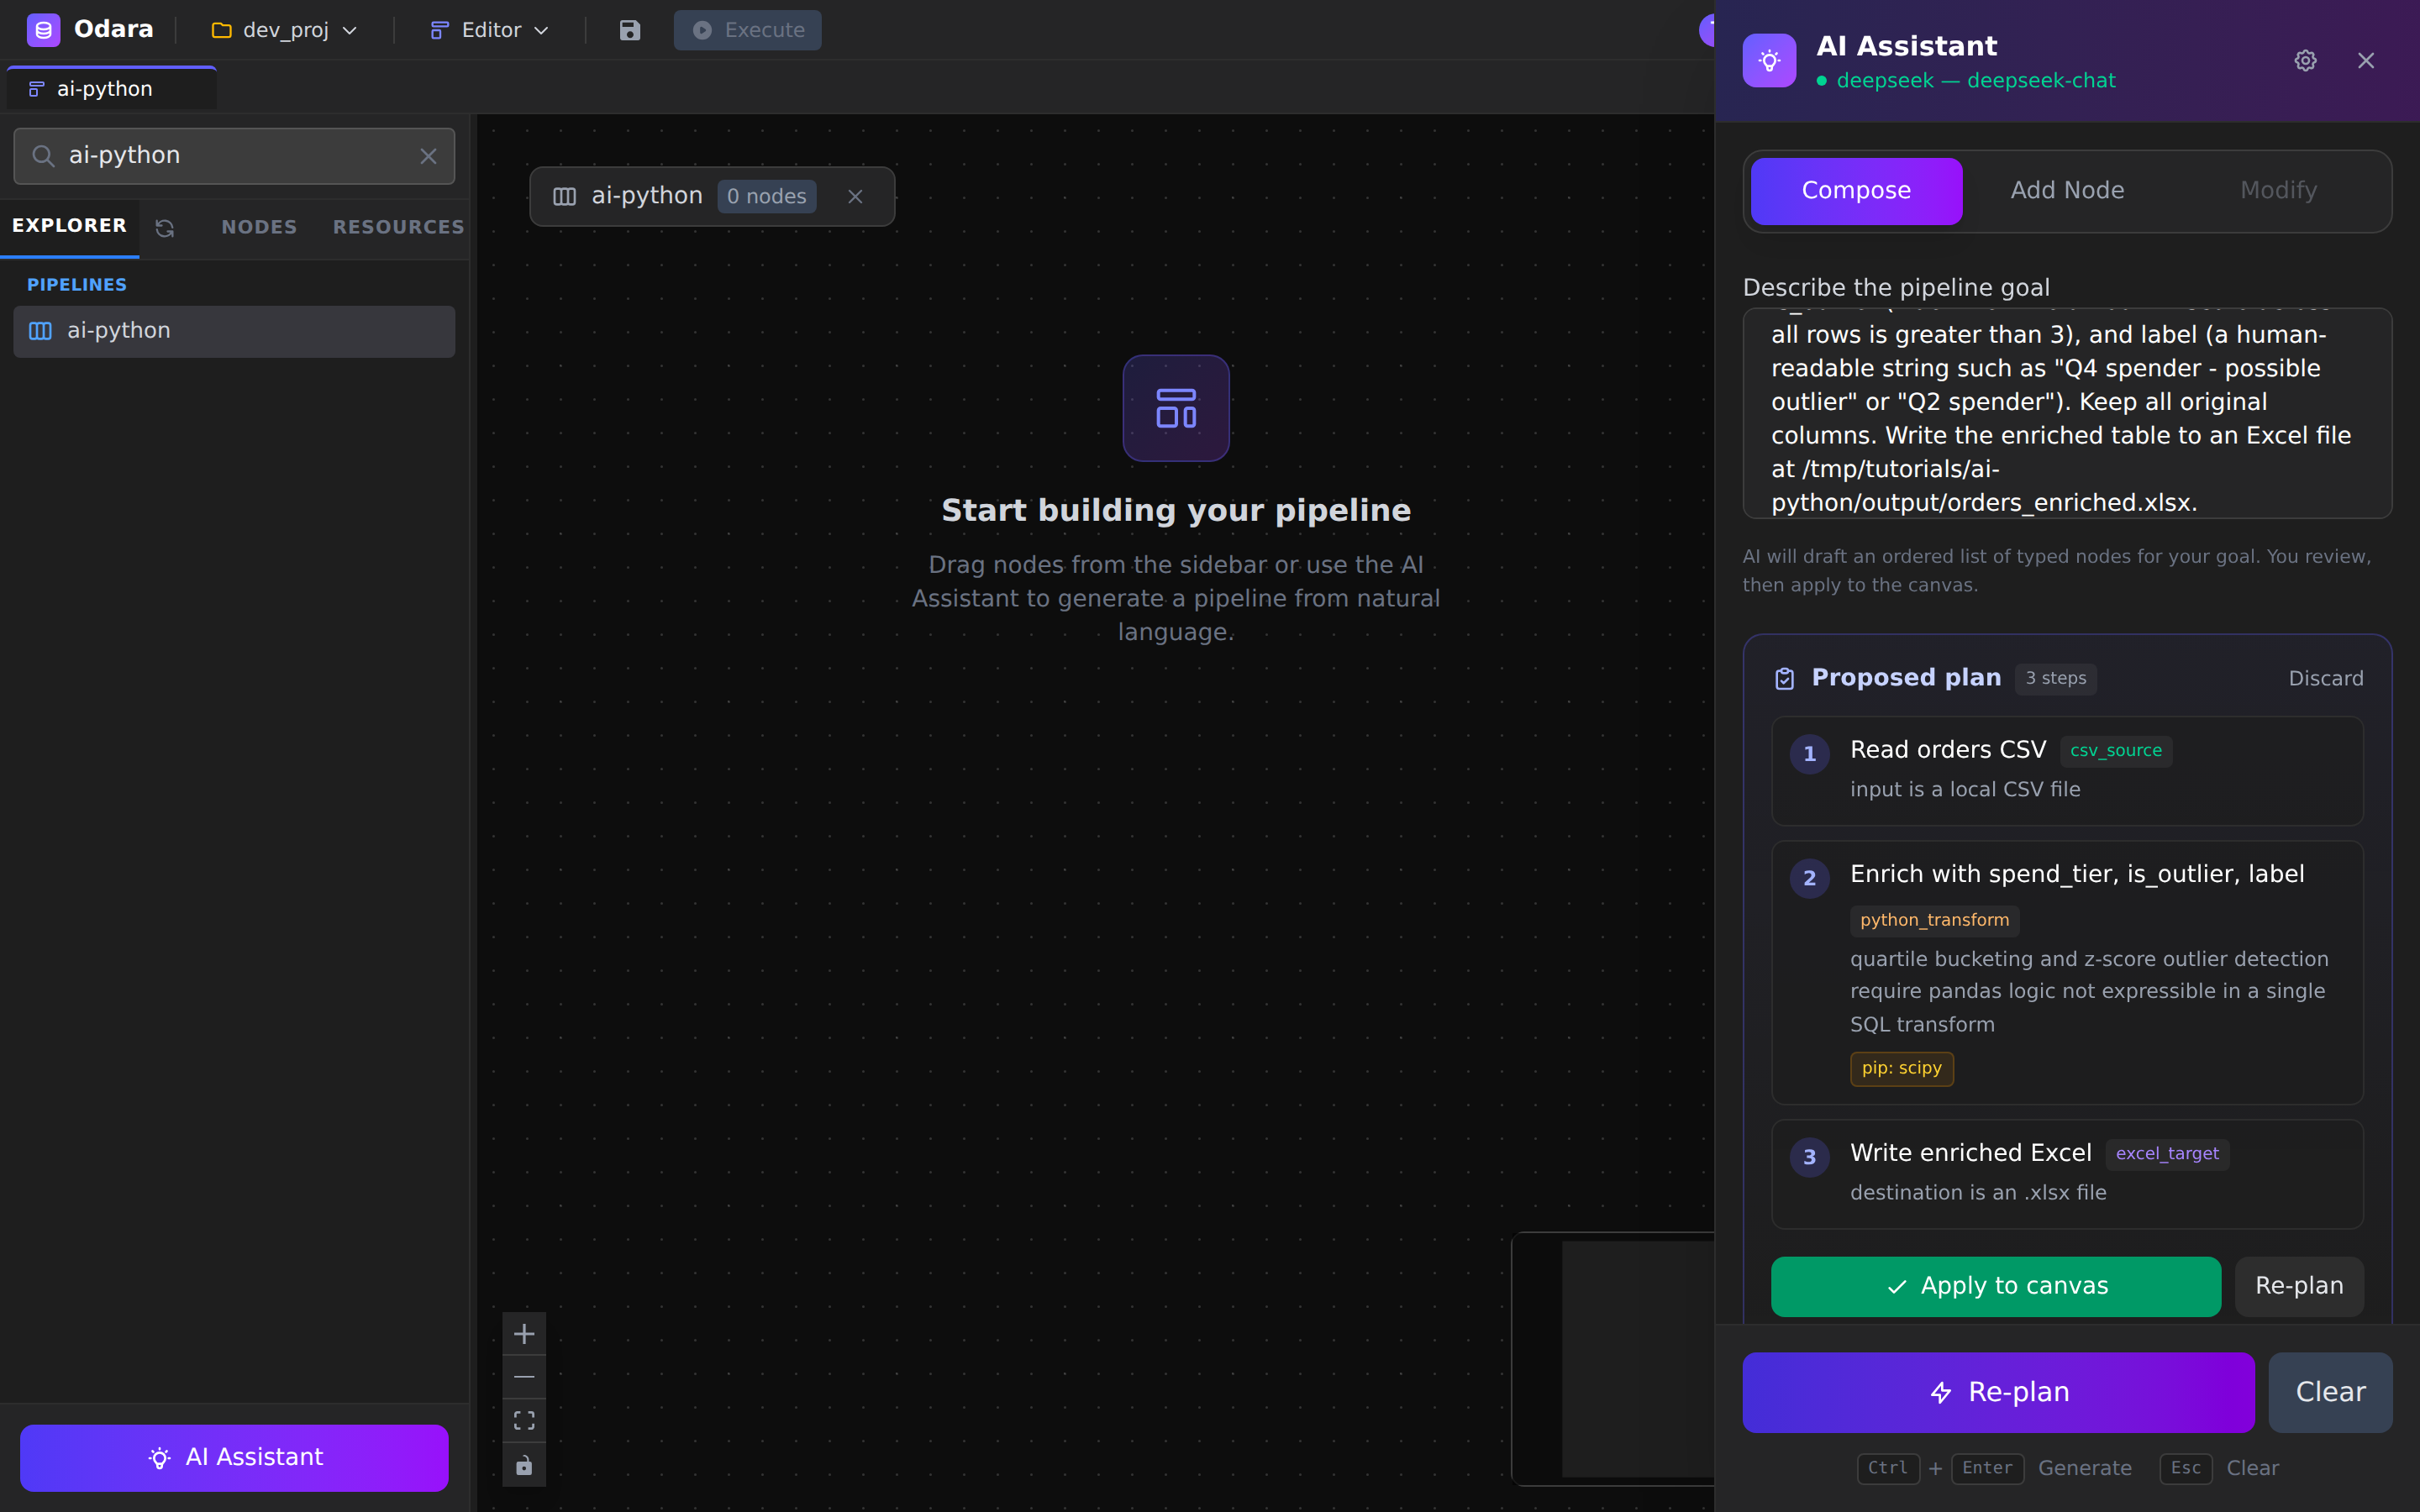
Three nodes:
- Read orders CSV —
csv_source - Enrich with spend_tier, is_outlier, label —
python_transform - Write enriched Excel —
excel_target
The AI correctly chose one Python node for all three derived columns (quartiles + z-score + label are naturally one pandas pass) rather than splitting them. Click Apply to canvas.
3. The pipeline appears, fully wired
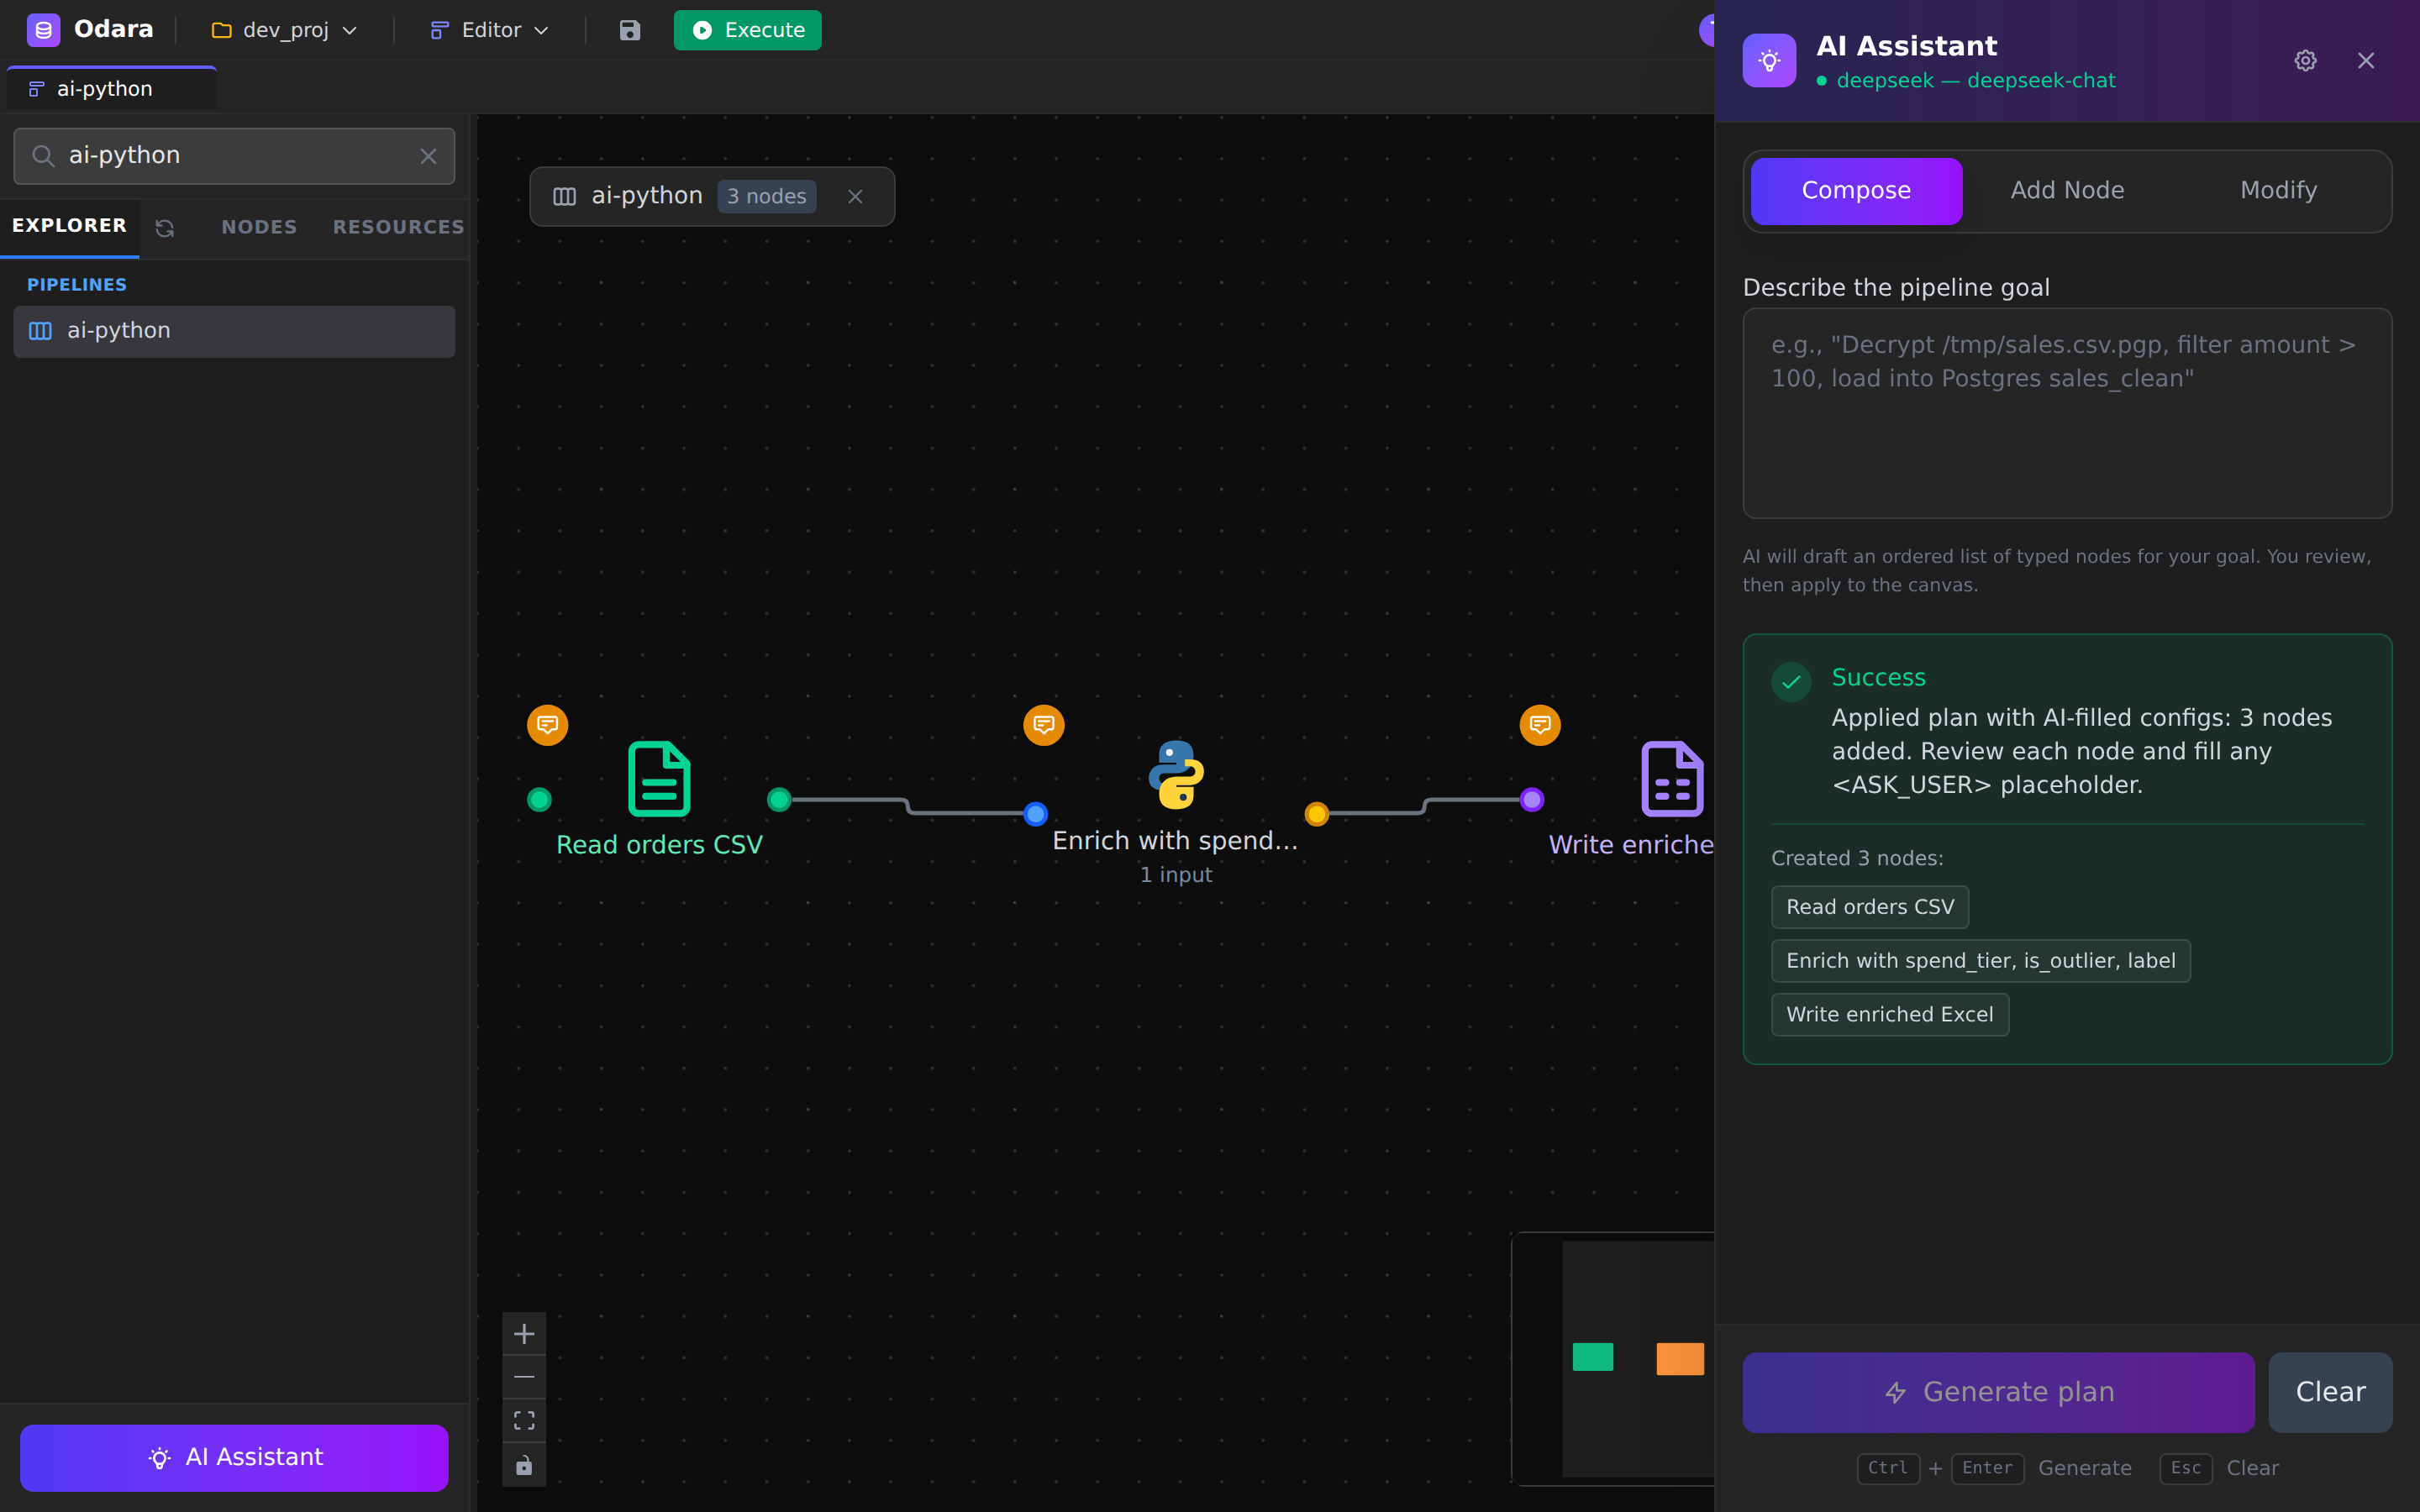
Source → Python transform → Excel target, connected and configured, with the success card listing the three created nodes.
4. Review the generated Python
Click the Enrich… node to see the pandas code the AI wrote:
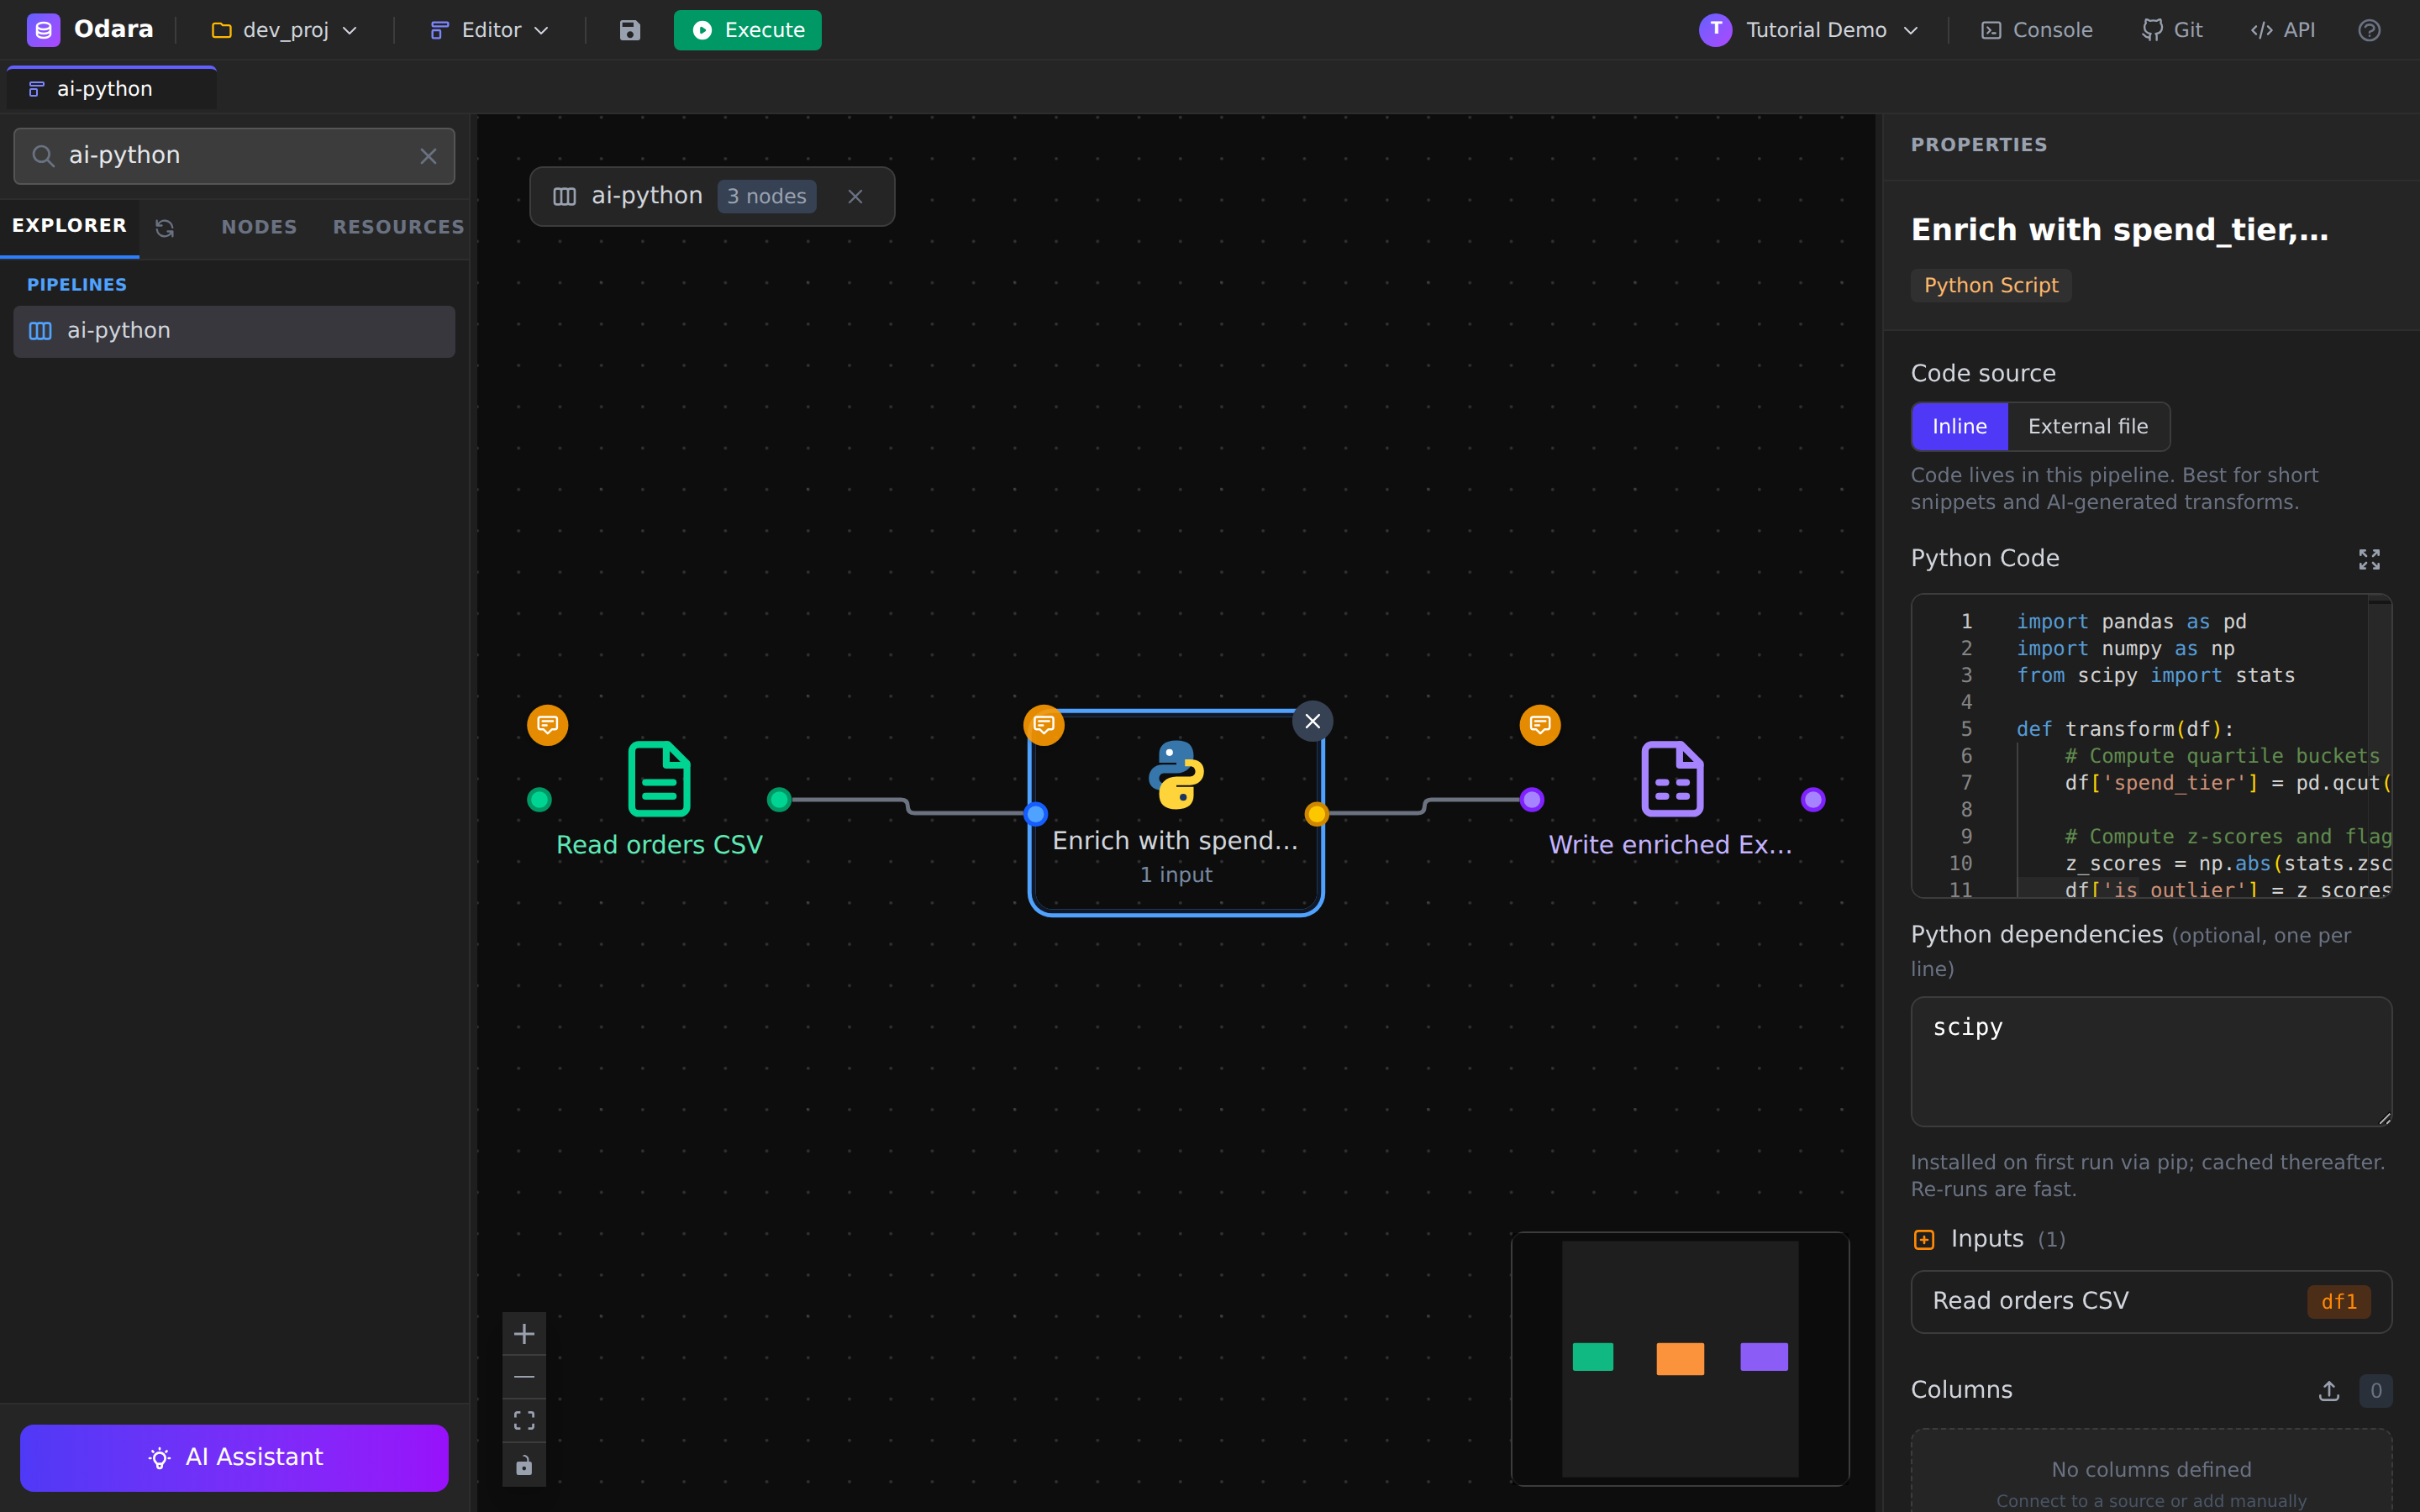
import pandas as pd
import numpy as np
from scipy import stats

def transform(df):
    # Compute quartile buckets
    df['spend_tier'] = pd.qcut(df['amount'], q=4, labels=['Q1', 'Q2', 'Q3', 'Q4'])

    # Compute z-scores and flag outliers
    z_scores = np.abs(stats.zscore(df['amount']))
    df['is_outlier'] = z_scores > 3

    # Build human-readable label
    df['label'] = df['spend_tier'].astype(str) + ' spender'
    df.loc[df['is_outlier'], 'label'] = df['spend_tier'].astype(str) + ' spender - possible outlier'

    return df
Three things to know about how Odara runs this:
- No
entry_functionneeded — Odara auto-calls a function namedtransform(df)if you define one. The AI follows that convention. - DataFrame in, DataFrame out —
dfis the upstream rows as a pandas DataFrame; whatever youreturnbecomes the node's output. - Dependencies — the AI used
scipy.stats.zscore. scipy ships with a standard install, so it ran as-is. If a generated transform imports something you don't have, that's your adjustment point: either install it, or ask the AI (Modify mode) to rewrite without it. For a z-score, the numpy-only swap is one line:z_scores = np.abs((df['amount'] - df['amount'].mean()) / df['amount'].std())
This is the "review and adjust" habit: the AI gets you a working transform in seconds; you confirm the dependencies and the logic match your reality.
5. Run and verify
Hit Execute.
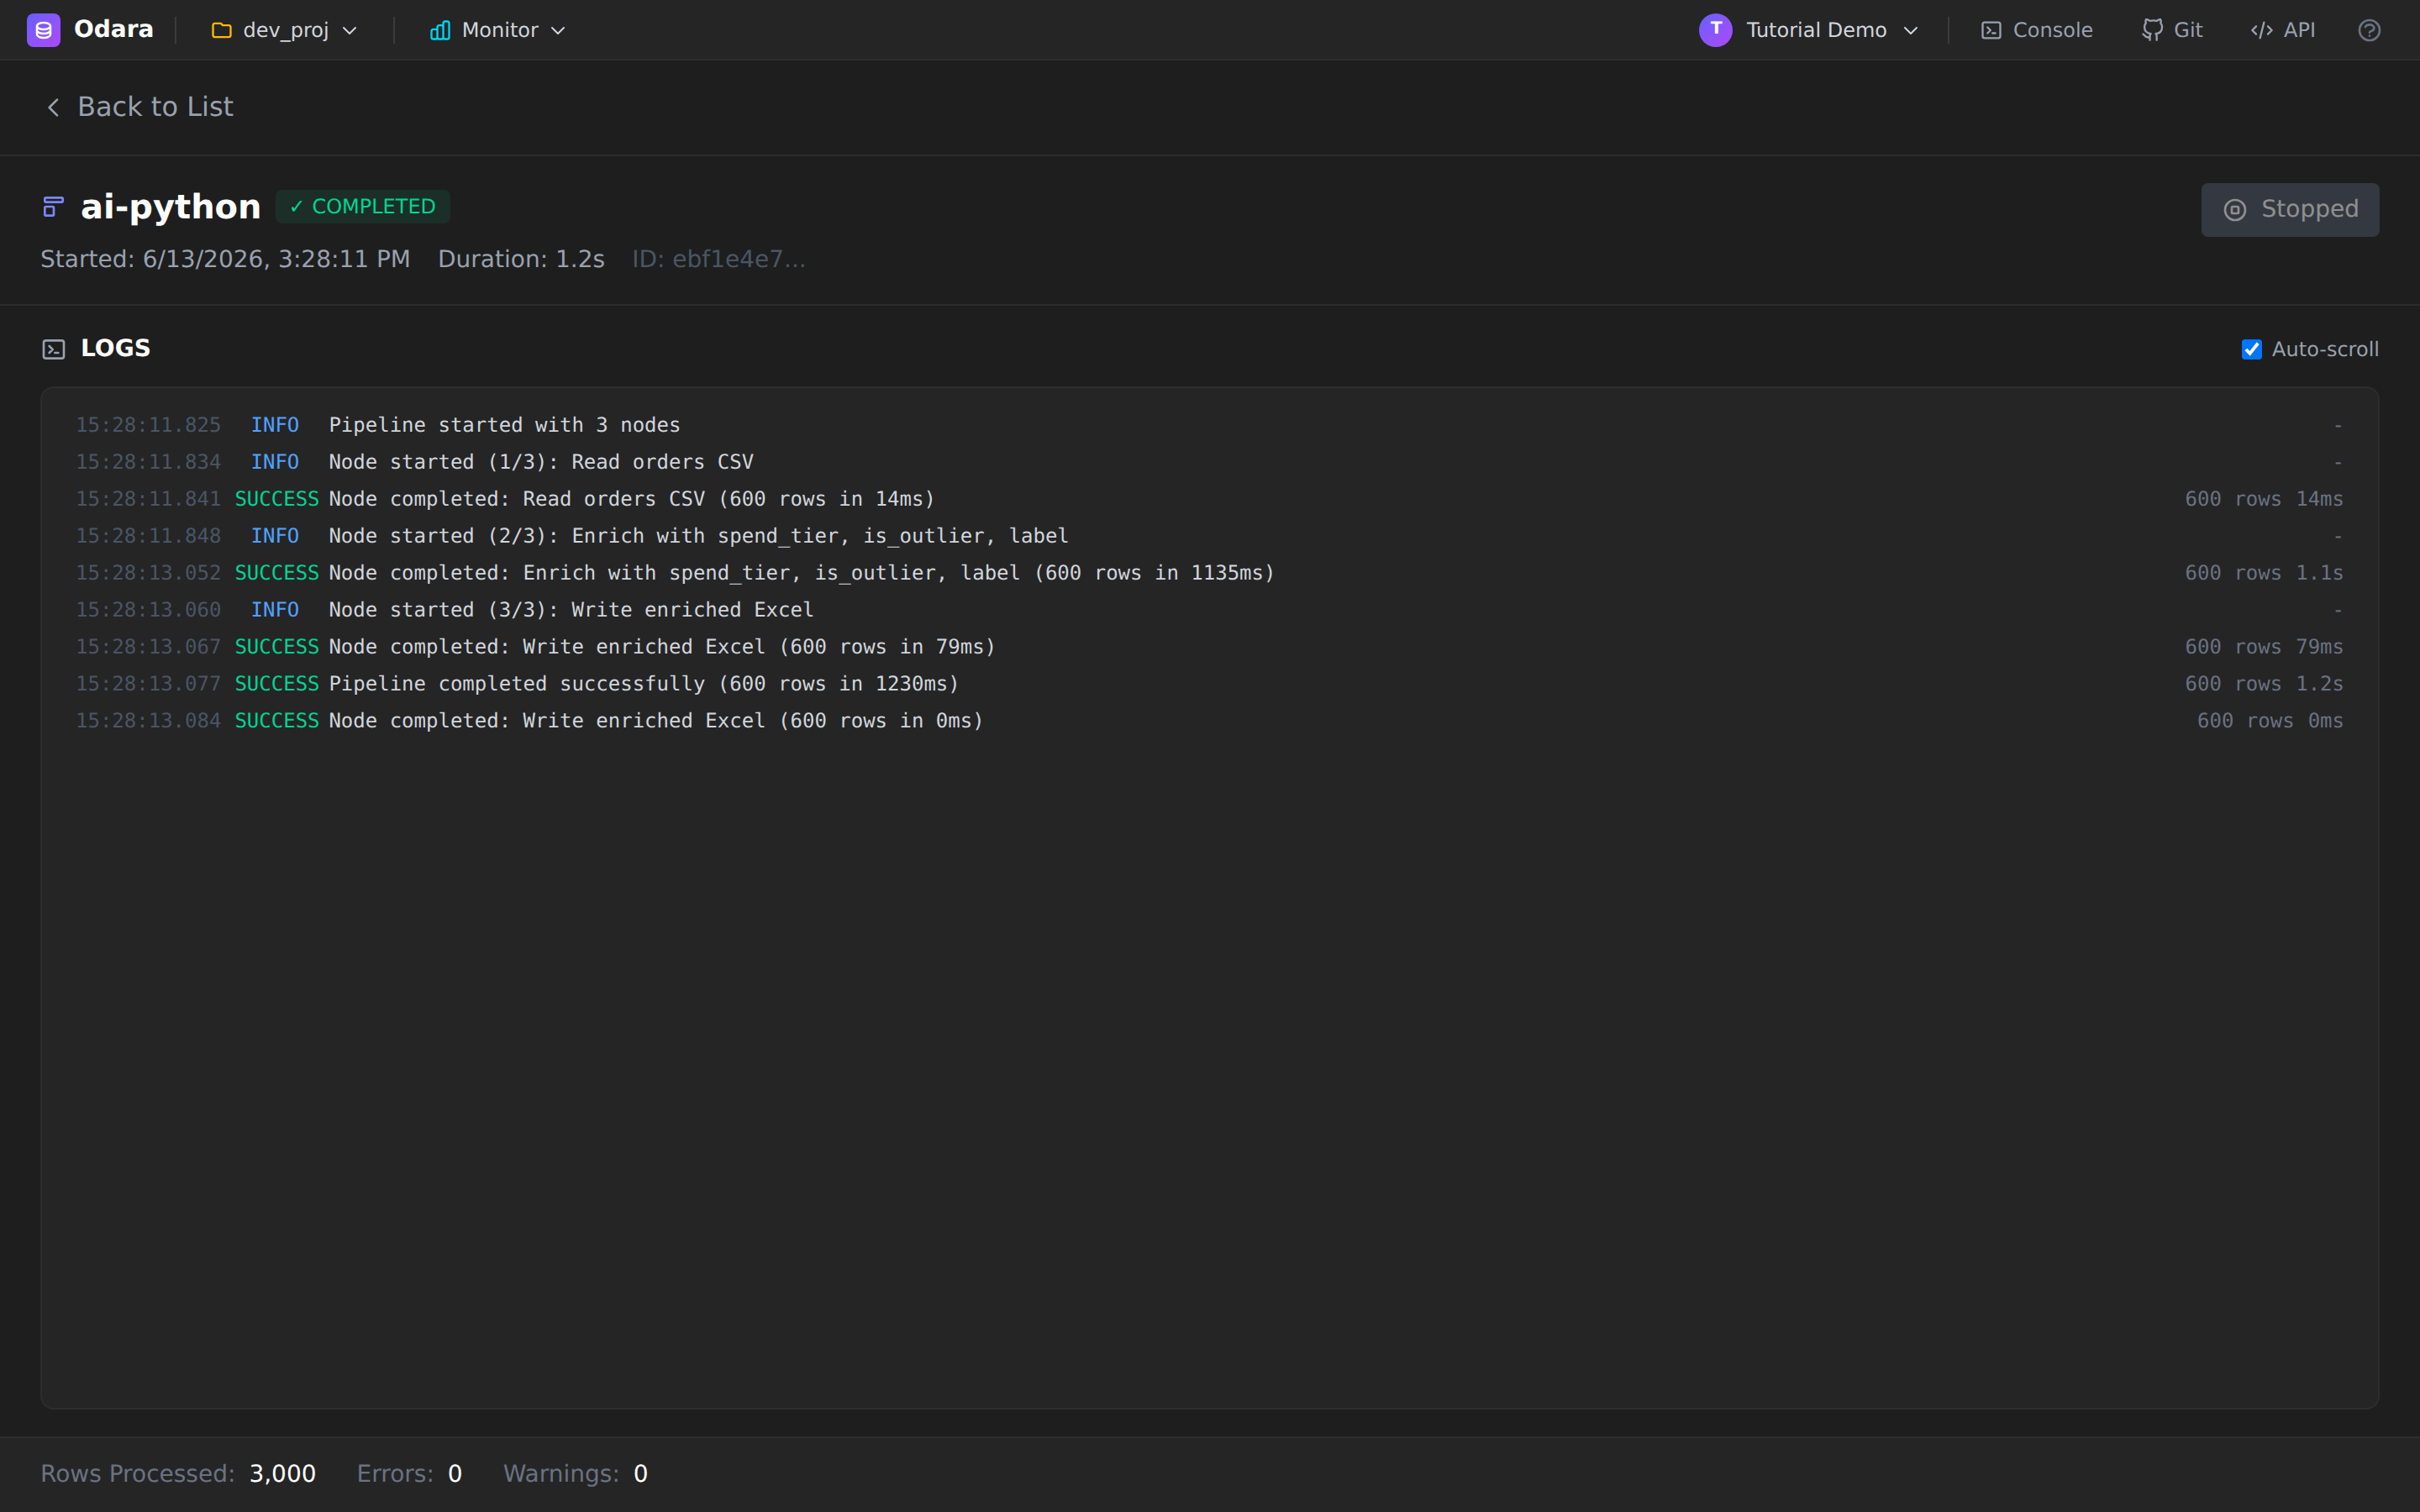
The LOGS show 600 rows flowing through all three nodes —
Pipeline completed successfully. Open the Excel file and you'll find the
three new columns next to the originals:
order_id  customer  amount   order_date  spend_tier  is_outlier  label
2001      Carla     43.27    2026-03-02  Q1          False       Q1 spender
2010      Ana       1463.14  2026-05-09  Q4          True        Q4 spender - possible outlier
Across the 600 rows, the z-score rule flags 22 outliers — the deliberately-large orders — while quartiles split everyone into Q1–Q4 by spend. All from one sentence.
Cheat sheet
| I want to… | Do this |
|---|---|
| Generate a Python pipeline | AI Assistant → Compose, and say "using a Python transform with pandas". |
| Make the AI pick Python over SQL | Name the library/technique (pandas, numpy, scikit-learn) in the prompt. |
| See/edit the generated code | Click the Python Transform node → code editor. |
| Define the entry point | Just write def transform(df): … return df — Odara auto-calls it. |
| Drop a dependency you don't have | Modify mode: "rewrite without scipy", or install the package. |
| Write to Excel | An excel_target with a path ending in .xlsx. |
What you learned
- Compose builds Python pipelines too — name the technique and the AI reaches for pandas/numpy/scipy instead of SQL.
- The generated transform follows Odara's
transform(df)convention, so it runs with no extra wiring. - Review dependencies and logic — the AI is fast and usually right, but you own the final check (a missing package is the most common fix).
- A statistical enrichment (quartiles + z-score outliers + labels) that would be tedious by hand is one prompt away.